
-
Publish Your Research/Review Articles in our High Quality Journal for just USD $99*+Taxes( *T&C Apply)
Offer Ends On
Publish Your Research/Review Articles in our High Quality Journal for just USD $99*+Taxes( *T&C Apply)
Offer Ends On
Bernard Moeketsi Hlalele*, Mokhantso Makoae, Caiphus Baloyi, Bathabile Nhleko, Gcina Malandela and FefisaRwanqa-Mokete
Corresponding Author: Bernard Moeketsi, Human Sciences Research Council, Developmental, Capable and Ethical States Division Pretoria, 0002, South Arica.
Received: February 11, 2026 ; Revised: February 15, 2026 ; Accepted: February 17, 2026 ; Available Online: February 19, 2026
Citation: Hlalele BM, Makoae M, Baloyi C, Nhleko B, Malandela C, et al. (2026) Assessing Long-Term Trends and Variability in Precipitation Patterns: A Study in the Northern Cape, South Africa. J Agric For Meterol Stud, 4(3): 1-13.
Copyrights: ©2026 Hlalele BM, Makoae M, Baloyi C, Nhleko B, Malandela C, et al. This is an open-access article distributed under the terms of the Creative Commons Attribution License, which permits unrestricted use, distribution, and reproduction in any medium, provided the original author and source are credited.
Views & Citations
Likes & Shares
The Northern Cape, the largest province in South Africa, is characterized by an arid to semi-arid climate, marked by low and highly variable precipitation. Rainfall patterns in this region exhibit pronounced seasonality and notable spatial heterogeneity, which carry significant implications for agricultural practices and water resource management. In light of the increasing unpredictability of precipitation and the rising concerns regarding climate variability, this study investigates long-term trends in rainfall and their potential impacts on agricultural livelihoods within the Northern Cape. The objectives of this study included the analysis of historical precipitation trends and variability, with a focus on potential changes in annual rainfall totals, seasonal distribution, and the occurrence of extreme weather events. Data were obtained from NASA's POWER database and analyzed using JASP software. The Mann-Kendall trend test was employed to identify monotonic trends, while the Kreskas-Wallis test was utilized to examine spatial variations in rainfall across five district municipalities. Descriptive statistical methods, encompassing measures of central tendency, dispersion, and outlier detection, were applied to elucidate rainfall patterns and variability. The results revealed significant regional disparities in precipitation, with Frances Baard and John Tool districts exhibiting higher mean rainfall compared to Namakwa and ZF Mgcawu. Although no statistically significant long-term decline in rainfall was identified, the study found increasing variability, characterized by prolonged dry spells and isolated extreme rainfall events. These fluctuations present substantial risks to agricultural sustainability, particularly for smallholder farmers who depend on rain-fed agriculture and livestock grazing. The findings highlight the necessity for adaptive water management strategies, enhanced climate forecasting, and targeted support for farmers. Policy recommendations include the enhancement of irrigation infrastructure, the promotion of drought-resistant agricultural practices, and the strengthening of early warning systems. Future research should prioritize the integration of socioeconomic factors into climate adaptation strategies to improve resilience among vulnerable communities in the Northern Cape.
KEYWORDS: Precipitation Variability, Climate Change Adaptation, Northern Cape Agriculture, Extreme Weather Events
INTRODUCTION
The Northern Cape Province, the largest province in South Africa by land area, covering approximately 30% of the country, is also the driest region. It predominantly experiences an arid to semi-arid climate, with most areas receiving less than 400 mm of rainfall annually and a provincial average of only around 200 mm per year (Tyson, 2020). Rainfall is highly variable across this vast landscape. The western coastal zone, known as Namaqualand, falls within a winter rainfall regime, receiving limited winter showers from Atlantic frontal systems, while the eastern parts of the province receive summer precipitation from convective thunderstorms (Schulze, 2016). This east-west contrast results in annual rainfall ranging from less than 50–100 mm in the far northwest to approximately 400 mm in the southeast. Such low and uneven precipitation, combined with strong seasonal variation and high interannual variability, renders the Northern Cape particularly vulnerable to water stress and drought. The variability of the province's climate is a defining characteristic of its environment. Historical records indicate significant fluctuations between wet and dry periods; for instance, South African rainfall was above average during the 1970s and 1980s but below average in the 1960s and early 2000s (Mengistu et al., 2020).
Droughts in the Northern Cape are recurrent and often severe, impacting local communities (Bahta & Nyaki, 2024). Trends over recent decades suggest shifts in rainfall characteristics rather than overall totals. Studies indicate a decrease in the number of rainy days, coupled with an increase in heavy rainfall events, resulting in prolonged dry spells and more intense downpours in various parts of the country (Kruger & Shongwe, 2021). These changes are consistent with broader climate change projections indicating that semi-arid regions will face increased rainfall variability and extreme weather events. In the Northern Cape, rising temperatures exacerbate aridity by increasing evaporation demand. Consequently, even if annual precipitation does not show a significant long-term decline (Davis, Hoffman, & Roberts, 2016), effective water availability is decreasing, intensifying the impacts of drought and challenging traditional farming practices.
Understanding long-term precipitation trends and variability in this context is critically important. The economy of the Northern Cape and the livelihoods of its rural communities heavily depend on climate-sensitive sectors such as agriculture and pastoralism. Much of the farming in this province is rain-fed; even large irrigation schemes, such as the Vaalharts scheme, ultimately rely on river flows replenished by rainfall (Conradie, Piesse, & Thirtle, 2019). Livestock farming, primarily sheep and goats, dominates land use, accounting for approximately 75% of agricultural enterprises. However, this reliance on sparse and unpredictable rainfall makes these systems inherently vulnerable (Meadows & Hoffman, 2021). In recent years, the Northern Cape has experienced one of the worst drought episodes on record (2015-2020), prompting disaster declarations and emergency relief efforts. By 2017, provincial livestock numbers had decreased by over 30% as farmers destocked herds in response to deteriorating grazing conditions and water shortages. Such impacts illustrate that shifting precipitation patterns pose a direct threat to food security, income, and the way of life in the region. Smallholder farmers often have limited buffers, and many have struggled to cope with consecutive droughts (Bradstock, 2005; Ntombela & Van der Merwe, 2023). This situation indicates the necessity of assessing whether the climate is becoming drier or more erratic over time and how communities might adapt.
This study aims to investigate long-term trends and variability in precipitation in the Northern Cape, South Africa, and to discuss their implications for agriculture and livelihoods. Through analyzing historical rainfall records and climate indices, we seek to determine if there are significant trends (e.g., declines or increases in annual rainfall, changes in seasonality) and to characterize the variability (e.g., frequency of drought years or extreme wet years). The objectives of the study are to: (i) quantify long-term precipitation trends in the Northern Cape over the past several decades, including changes in annual totals and seasonal distribution; and (ii) evaluate the implications of observed rainfall patterns for agricultural production and rural livelihoods, thereby identifying potential risks and adaptation needs for farming communities. This research is significant as it addresses a critical environmental challenge in a water-scarce region. Reliable information on precipitation trends and variability will inform climate adaptation strategies and policy planning in the Northern Cape.
Precipitation patterns in the Northern Cape
The rainfall regime of the Northern Cape is characterized by scarcity, spatial heterogeneity, and pronounced seasonality. The province encompasses both winter and summer rainfall zones, resulting in distinct regional patterns (Schulze, 2016). Coastal and far southwestern areas, such as Namaqualand, receive modest rainfall during winter (approximately May-August) from the few cold fronts that penetrate inland. In contrast, the central and eastern districts receive the majority of their precipitation in the late summer months (January-March) through convective thunderstorms that occasionally originate from the interior. This bimodal pattern has led to adaptations in growing seasons and water availability calendars among communities across the Northern Cape. Mean annual precipitation (MAP) remains very low throughout the province, ranging from approximately 50-100 mm in the driest northwest to around 300-400 mm in some eastern and southern regions (Tyson, 2020; Davis et al., 2016). In comparison, South Africa’s national average rainfall is about 460 mm, underscoring the relative aridity of the Northern Cape (World Bank, 2021). The province’s climate can thus be classified as desert and semi-desert, particularly towards the Namib fringe and Kalahari.
One significant consequence of this climatic gradient is the extreme limitation of water resources; many rivers are episodic, and groundwater often serves as the primary supply for farms and towns. Given its aridity, it is essential to investigate whether precipitation in the Northern Cape is experiencing further decline or exhibiting any directional trends due to climate change. Several studies have analyzed rainfall records in various parts of the province, yielding mixed findings. For example, Davis et al. (2016) examined a century of data in the winter rainfall region of Namaqualand and found no clear long-term trend in annual rainfall totals or in the frequency of rain days. Their analysis indicated significant year-to-year fluctuations in total rainfall, but without a statistically significant increase or decrease over time. Similarly, no consistent changes in rainfall intensity were detected, which is an important consideration given expectations that climate change may impact the frequency of extreme weather events. However, Davis et al. noted some spatial differences in seasonal trends, indicating localized shifts in the timing of rainfall (e.g., slight changes in contributions from spring versus autumn in some inland areas).
On a broader scale, Kruger and Shongwe (2021) report that the western regions of Southern Africa have not experienced a robust trend in mean annual precipitation in recent decades, while the eastern parts of the country have seen slight increases in heavy rainfall events. Within the Northern Cape, long-term rain gauges suggest that interannual variability predominates over any monotonic trend (Tyson, 2020). This implies that wet and dry cycles have always been integral to the climate signal in the region, complicating the differentiation between human-induced changes and natural variability. Nonetheless, climate model projections for the area frequently suggest a potential drying of the winter rainfall zone and a delayed onset of summer rains in the future (Christensen et al., 2013). Even if total annual rainfall remains near historical norms, shifts in seasonality or increases in evaporative demand could significantly reduce water availability for ecosystems and agriculture.
In addition to temporal trends, research highlights the geographical variability of precipitation in the Northern Cape. Meadows and Hoffman (2021) emphasize that the province’s diverse landscapes, ranging from the Karoo plains to the Kalahari dunes, receive varying amounts of rainfall, which subsequently influence vegetation and land use patterns. For instance, the Kamiesberg highlands in western Namaqualand can receive over 400 mm of precipitation annually, supporting pockets of mountain fynbos, while extensive areas of the lower Namaqualand plain receive less than 100 mm and remain true desert (Cowling, Proches, & Partridge, 2017). The Eastern Kalahari region, particularly around Kuruman and Upington, receives summer thunderstorms that can occasionally produce substantial downpours, supporting grassland and savanna vegetation (Dean & Milton, 2016). Understanding these patterns is critical, as any changes in the rainfall regime, such as shifts in storm tracks or increased frequency of dry years, can lead to alterations in vegetation and affect grazing capacity.
Climate variability and extreme events
Year-to-year climate variability in the Northern Cape is considerable, and the management of this variability has historically been central to the livelihoods of its inhabitants. The literature consistently indicates that drought is a recurrent characteristic of the province's climate (Bahta & Nyaki, 2024; Bradstock, 2005). Rainfall variability arises from a multitude of factors, with one significant driver being the influence of large-scale ocean-atmosphere phenomena, such as the El Niño-Southern Oscillation (ENSO). During El Niño events, Southern Africa, particularly the western and interior regions, typically experiences below-normal rainfall and elevated temperatures, resulting in widespread drought conditions (Tyson, 2020). Conversely, La Niña phases may yield wetter conditions. These oscillations, combined with the positioning of the subtropical high-pressure belt, contribute to dramatic fluctuations in precipitation from one year to the next. For instance, a period of above-average rainfall in one year may be succeeded by several years of drought, with limited predictability beyond seasonal forecasts. Historical climate data for South Africa indicate an increase in the frequency of multi-year droughts during the late 20th and early 21st centuries, particularly in the western regions. The Northern Cape has experienced severe droughts in the early 1980s, mid-1990s, and most recently in the mid-2010s, each resulting in significant agricultural losses.
In addition to natural variability, there is mounting evidence that anthropogenic climate change is modifying the characteristics of extreme weather events. Although total annual rainfall has not significantly diminished, the intensity of extreme events has become more pronounced. Reports from South Africa's climate scientists indicate a decline in the number of rainy days overall, coupled with an increase in the frequency of intense rainfall events (Kruger & Shongwe, 2021). Essentially, precipitation is occurring in shorter, more intense bursts, interspersed with prolonged dry spells. This pattern heightens the risk of both droughts and flash flooding. In arid regions such as the Northern Cape, a month's worth of rain may fall during a single storm; if such storms become more intense but less frequent, the net effect is extended dry periods that strain water resources, followed by events that primarily run off and fail to adequately recharge soil moisture. The Department of Environmental Affairs has observed an extension of dry spells in South Africa since the 1970s, which is associated with rising temperatures and shifting weather patterns. Elevated temperatures exacerbate drought conditions by increasing evaporation from both soil and water bodies. As Hoffman et al. (2018) discuss, a temperature increase of just 1-2°C (already documented in the Northern Cape over the past century) can significantly elevate evapotranspiration rates, necessitating greater water availability for plants and crops to endure the same duration of dryness.
Climate projections for the Northern Cape suggest sustained high variability and the potential for more extreme droughts under various climate change scenarios. Meadows and Hoffman (2021) caution that land degradation may worsen if droughts become more frequent or prolonged, as vegetation and topsoil will have diminished opportunities to recover. Some climate models predict a poleward shift of winter storm tracks, which could lead to a reduction in winter rainfall in the far western regions of South Africa (Mudambi et al., 2020). Simultaneously, summer rainfall in the eastern Northern Cape may become increasingly erratic, characterized by longer dry spells interspersed with sporadic intense thunderstorms. The El Niño-induced drought of 2015-2016 across Southern Africa serves as a pertinent analog for future conditions: it resulted in severe water shortages and was subsequently followed by an unusually wet year in certain areas of the country, an alleviation that, however, arrived too late for many farmers. This volatility complicates agricultural planning and water management. In response, there is a growing emphasis in the literature on enhancing climate resilience and forecasting capabilities. For example, Bahta and Nyaki (2024) developed a drought vulnerability index for smallholder farmers in the Northern Cape, underscoring the necessity for improved early warning systems and support mechanisms. Overall, climate variability, both natural and anthropogenically influenced, remains a fundamental challenge in the Northern Cape, necessitating adaptive strategies to mitigate the impacts of the emerging "new normal" characterized by extremes.
Implications for agriculture and livelihoods
The fluctuations and trends in precipitation outlined above have direct and extensive implications for agriculture and rural livelihoods in the Northern Cape. This province possesses a predominantly agrarian economy, excluding the mining sector, with livelihoods intricately linked to the land. Agricultural systems in this region have adapted to aridity, exemplified by extensive livestock ranching on natural rangelands and crop cultivation primarily in irrigated or marginally less arid areas. Nonetheless, the increasing unpredictability of rainfall is placing significant strain on these traditional livelihood strategies (Ntombela & Van der Merwe, 2023). During periods of drought, grazing lands deteriorate rapidly, compelling pastoralists to either reduce herd sizes or risk overstocking the fragile terrain. Smallholder livestock farmers are often the most adversely affected. A recent study in the Frances Baard District (eastern Northern Cape) identified recurring drought as a "major challenge" for smallholder farmers, rendering many of them highly vulnerable regarding food security and income (Bahta & Nyaki, 2024). Numerous such farmers lack access to irrigation or financial reserves, thereby rendering households susceptible to collapse following a series of poor rainfall seasons.
Empirical evidence from previous droughts illustrates the socioeconomic consequences. The multi-year drought from 2015 to 2018 resulted in drastic herd reductions as farmers were compelled to sell or lost animals to starvation and disease. Reports indicate that commercial livestock operations in the Northern Cape experienced a reduction in herd sizes by approximately one-third due to this drought, with recovery proving to be slow. For small-scale farmers, the loss of livestock, often their principal assets, translates into diminished wealth and reduced livelihood opportunities for extended periods. Wheeler et al. (2023) document community initiatives that arose during this period, such as the “Save the Sheep” campaign, which provided feed and assistance to struggling farmers (Visagie, 2024). Such initiatives highlight both the severity of the impacts and the significance of social support networks in enhancing resilience. Beyond livestock, the province’s limited crop farming areas (such as the Orange River Valley and the Vaalharts irrigation scheme) are also exposed to risks. During droughts, water allocations for irrigation are curtailed, adversely impacting high-value crops such as grapes, fruits, and cotton (Botha & Erasmus, 2022). Rain-fed cereal production (e.g., maize in certain districts) becomes virtually unfeasible in severe drought years, jeopardizing local food supplies. Several studies emphasize factors that exacerbate vulnerability within Northern Cape communities. Bradstock (2005) notes that many rural households historically depended on migrant labor and remittances as a livelihood strategy, as agriculture alone often proved inadequate. Consequently, when local farming fails (e.g., due to drought), alternative income sources become essential. However, unemployment and poverty in the region constrain these alternatives. The same study and others (Hall, 2018; Ntsebeza, 2020) indicate that land reform efforts have redistributed some farmland to previously disadvantaged farmers; however, these new farmers frequently lack access to capital, extension services, and water infrastructure. In the absence of support, they remain highly vulnerable to climate stress. Indeed, Ntombela et al. (2023) found that limited livelihood diversification, inadequate social safety nets, and insufficient infrastructure (such as water storage or boreholes) exacerbate vulnerability in Northern Cape farming communities. These findings suggest that climate impacts do not operate in isolation but intersect with prevailing socioeconomic conditions. For instance, a well-resourced commercial farm may navigate a drought by utilizing groundwater or affording feed imports, whereas a small communal farmer may suffer total losses during the same climatic event.
Adaptation and resilience are recurrent themes in the literature regarding this region. There is a consensus that proactive measures are imperative to safeguard livelihoods against escalating climate risks. Recommended strategies include diversifying income sources (e.g., integrating livestock with drought-tolerant crops or other enterprises), enhancing water management (such as investing in rainwater harvesting, drip irrigation, or more efficient communal water schemes), and fortifying local institutions and social networks (Bahta & Nyaki, 2024; Ntombela & Van der Merwe, 2023). Building resilience also necessitates information and planning. For example, improved seasonal forecasting and dissemination can empower farmers to make informed decisions regarding stocking rates or planting dates. Some farmers in the Northern Cape have begun adjusting grazing plans and employing conservative stocking densities to mitigate rangeland degradation during drought years (Meadows & Hoffman, 2021). Others have adopted innovative practices such as supplementary feeding or transitioning to more drought-resistant livestock breeds. Although the government and NGOs have initiated drought relief programs, these tend to be reactive in nature.
Top of Form
Bottom of Form
Study area description
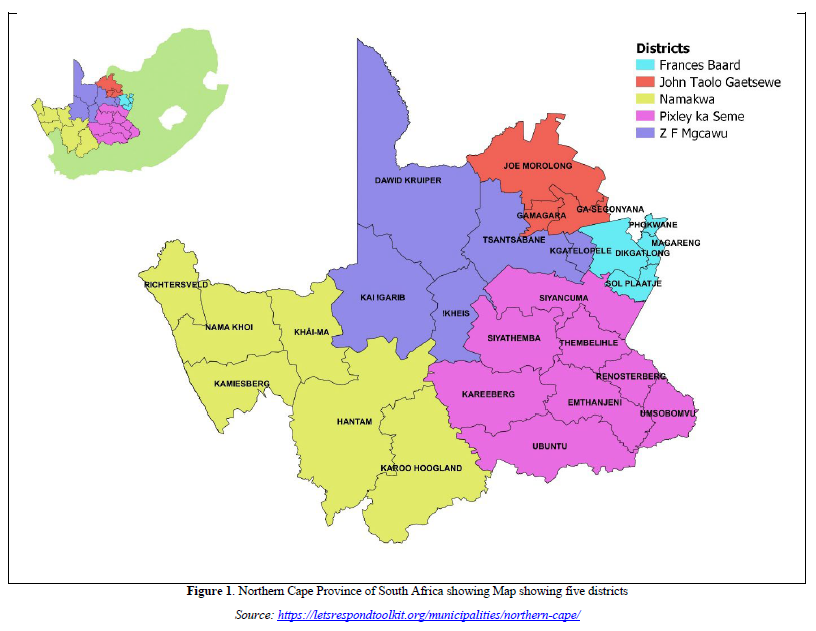
The Northern Cape, the largest province in South Africa, is characterized by its vast arid landscapes, unique topography, and a climate that presents both challenges and opportunities for agricultural practices and livelihoods. Figure 1 depicts the map of Northen Cape showing the five districts as the study area.

Climate
The Northern Cape is characterized predominantly by an arid to semi-arid climate, with the majority of regions receiving annual precipitation of less than 400 mm, averaging approximately 202 mm (Tyson, 2020). Rainfall distribution across the province exhibits notable variation: the western areas typically experience winter precipitation, while the eastern regions benefit from late summer thunderstorms (Schulze, 2016). Temperature extremes are prevalent, with summer maxima frequently exceeding 30°C and occasionally surpassing 40°C. Conversely, winter temperatures in locations such as Sutherland often fall below -10°C (Kruger & Shongwe, 2021).
Topography
The Northern Cape's landscape is predominantly defined by the Karoo Basin, which is primarily composed of sedimentary rocks interspersed with dolerite intrusions (Partridge & Maud, 2018). The southern and southeastern regions exhibit high-lying areas that range from 1,200 to 1,900 meters above sea level, particularly in the Roggeveld and Nuweveld districts (Van Wyk & Smith, 2021). The west coast is characterized by the Namaqualand region, which is renowned for its springtime floral displays and features hilly mountainous terrains comprised of granite and metamorphic rocks (Cowling et al., 2017). Central areas are predominantly flat, punctuated by salt pans, while the northern regions extend into the Kalahari Desert, distinguished by parallel red sand dunes and acacia-dominated dry savannas (Thomas & Shaw, 2020).
Farming
Agricultural practices in the Northern Cape are significantly influenced by the region's climatic and topographical conditions. The Vaalharts Valley, located between the Vaal and Harts rivers, hosts one of the largest irrigation schemes in the Southern Hemisphere (Conradie et al., 2019). Established in the 1930s, this scheme has transformed the arid landscape into fertile agricultural land, supporting approximately 1,280 farms. The region is known for its production of a diverse range of crops, including olives, pecans, peanuts, citrus fruits, wine grapes, cotton, and various stone fruits (Wheeler & von Maltitz, 2021). Additionally, staple crops such as wheat, maize, and grains are cultivated (Botha & Erasmus, 2022). Livestock farming, particularly the rearing of sheep and goats, is prevalent in the Karoo and Kalahari regions (Dean & Milton, 2016). These areas are well-suited for extensive grazing due to sparse vegetation and arid conditions. However, the reliance on rainfall renders livestock farming particularly vulnerable to climatic variability (Meadows & Hoffman, 2021).
Livelihoods
The livelihoods of communities in the Northern Cape are intricately linked to the land and climatic conditions. Smallholder livestock farmers face significant challenges due to recurrent droughts (Bahta &Nyaki, 2024). A study assessing the livelihood vulnerability of these farmers in the Frances Baard District Municipality indicated a high level of vulnerability, attributed to factors such as limited livelihood options, food insecurity, inadequate social networks, health issues, water scarcity, and climatic variability (Bradstock, 2005). The study highlighted the necessity for strategic interventions aimed at enhancing resilience, including the diversification of income sources and improved access to resources (Ntombela et al., 2023). The prolonged drought from 2015 to 2023 had a considerable impact on farming communities. For instance, Isabella Visagie, a sheep farmer from the Karoo, experienced severe financial hardships, loss of livestock, and personal challenges during this period (Visagie, 2024). In response, she initiated ‘Save the Sheep,’ a platform designed to support farmers through alternative income opportunities and humanitarian aid, highlighting the importance of community care and resilience in the face of climatic adversities (Wheeler et al., 2023). Land reform policies have played a crucial role in shaping livelihoods in the Northern Cape. Historically, agriculture was a minor livelihood activity, with migrant labor and remittances becoming increasingly significant (Hall, 2018). The implementation of land reform aims to address these disparities; however, challenges persist in ensuring equitable access to resources and the promotion of sustainable agricultural practices (Ntsebeza, 2020).
METHODS AND MATERIALS
Data collection
Data for this study were acquired from NASA’s POWER (Prediction of Worldwide Energy Resource) database (https://power.larc.nasa.gov/data-access-viewer/), which provides high-resolution meteorological and climatological data. The dataset underwent processing to ensure accuracy and appropriateness for statistical analysis. Data analysis was performed exclusively using JASP software, which offers robust statistical computation and visualization capabilities.
Data quality control
Outliers in the precipitation dataset were identified utilizing the box-and-whisker plot method, a well-established technique for detecting extreme values that significantly deviate from the interquartile range (IQR). Boxplots facilitated the visualization of data dispersion and highlighted potential anomalies, ensuring that erroneous values were excluded from subsequent analyses. Outliers identified as data entry errors were subjected to further examination and, when necessary, adjusted through appropriate statistical methods to maintain data integrity.
Data analysis
Descriptive statistics were calculated to summarize key precipitation characteristics across the study area. Measures such as mean, median, standard deviation, interquartile range (IQR), skewness, and kurtosis were employed to evaluate rainfall distribution patterns across different districts. These statistical measures provide a foundational understanding of precipitation variability and central tendency, which are crucial for assessing climatic and hydrological patterns (Wilks, 2019; Tukey, 1977; Liu et al., 2022). To ascertain whether median precipitation levels significantly differed across the five district municipalities, the Kruskal-Wallis H test was employed. This non-parametric test is appropriate for comparing multiple independent groups when the assumption of normality is not met. It is frequently utilized in climatological research, where precipitation data often exhibit non-normal distributions (McKnight & Najab, 2010).
Long-term trends in precipitation were evaluated using the Mann-Kendall trend test, a widely recognized non-parametric method for detecting monotonic trends in time-series data. This test does not necessitate adherence to a specific distribution, rendering it suitable for analyzing climatic trends (Helsel & Hirsch, 2020). Sen’s slope estimator was further employed to quantify the rate of change in precipitation trends over time. The integration of these statistical tools ensures a detailed assessment of potential shifts in precipitation patterns (Sen, 1968). Visualization techniques were employed to enhance the interpretation of statistical results. Boxplots illustrated the distribution and central tendency of precipitation data, while time series plots depicted seasonal and annual variations in rainfall. Furthermore, trend analysis plots derived from the Mann-Kendall test showed potential increasing or decreasing rainfall patterns, thereby aiding in assessments of climate variability (Helsel & Hirsch, 2020). JASP software facilitated the generation of all statistical visualizations, ensuring clarity and precision in the interpretation of results. All statistical analyses and visualizations were conducted exclusively using JASP software. This software was selected for its efficiency in managing non-parametric statistical tests, data visualization, and its user-friendly interface, making it particularly suitable for climatological research.
RESULTS AND DISCUSSIONS
Table 1 shows the descriptive statistics of precipitation datasets across the five district municipalities in the Northern Cape: Frances Baard, John Taolo, Namakwa, Pixley, and ZF Mgcawa. These statistics provide insights into rainfall distribution, variability, and the presence of extreme values in each region. Frances Baard and John Taolo record the highest mean precipitation values, at 31.67 mm and 29.87 mm, respectively. In contrast, Namakwa, Pixley, and ZF Mgcawa show considerably lower mean values, with Namakwa receiving the least precipitation at 16.17 mm. This trend indicates significant regional disparities in rainfall, with Frances Baard and John Taolo experiencing relatively wetter conditions, while Namakwa and ZF Mgcawa remain drier. The standard deviation values further reinforce this variability. Frances Baard exhibits the highest standard deviation (41.30 mm), followed by John Taolo (35.49 mm), suggesting that these regions experience substantial fluctuations in rainfall. The lower standard deviation in Namakwa (17.27 mm) and ZF Mgcawa (21.33 mm) indicates relatively stable precipitation patterns, albeit at lower levels. The coefficient of variation (CV) provides an indication of relative dispersion in rainfall data. Frances Baard (1.304) and ZF Mgcawa (1.299) exhibit the highest coefficients, suggesting more erratic rainfall patterns with a high degree of fluctuation relative to the mean. Conversely, Namakwa (1.068) has the lowest CV, implying more consistent precipitation trends despite receiving lower rainfall. The interquartile range (IQR) values show the spread of the middle 50% of the data. Frances Baard (42.50 mm) and John Taolo (45.19 mm) display the widest IQRs, reflecting greater variability in their rainfall distributions. Namakwa has the narrowest IQR (17.79 mm), signifying less dispersion in its rainfall data.
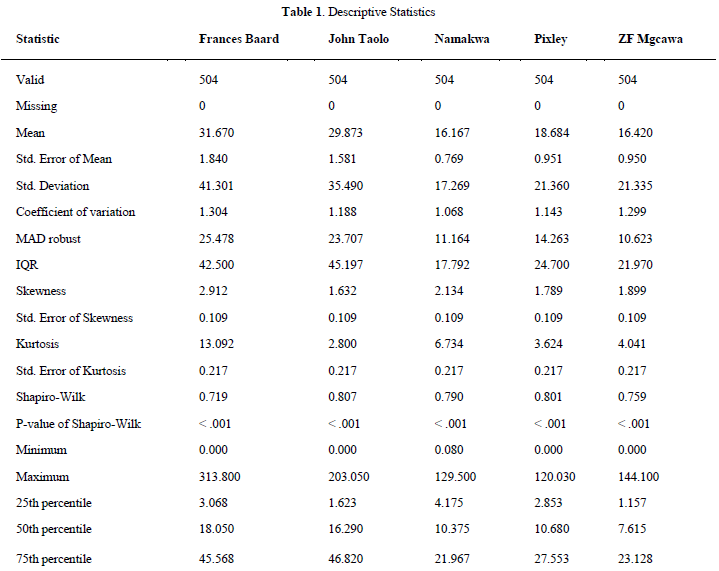
Skewness values indicate the asymmetry of the rainfall distribution. Frances Baard (2.912) and Namakwa (2.134) have highly skewed distributions, with a long tail toward higher values, implying occasional extreme rainfall events. Similarly, Pixley and ZF Mgcawa also show positive skewness, though less pronounced. This pattern suggests that while average rainfall remains low, extreme weather events occasionally bring significantly higher precipitation. Kurtosis measures the "peakedness" of the distribution. Frances Baard (13.092) and Namakwa (6.734) display highly peaked distributions, indicating that most precipitation values cluster around the mean, but with a few extreme outliers. John Taolo (2.800), Pixley (3.624), and ZF Mgcawa (4.041) exhibit lower kurtosis, implying a more moderate distribution of rainfall. The Shapiro-Wilk test confirms that precipitation data in all five districts deviate significantly from normality (p-values < 0.001). This justifies the use of non-parametric statistical tests, such as the Kruskal-Wallis test, for further analysis. The minimum and maximum precipitation values highlight substantial differences in extreme rainfall events. Frances Baard records the highest maximum rainfall event (313.8 mm), followed by John Taolo (203.05 mm). Namakwa, Pixley, and ZF Mgcawa have significantly lower maxima, reinforcing their drier climates. The presence of zero values in most districts suggests frequent dry spells or periods of no rainfall. The 25th, 50th (median), and 75th percentiles further illustrate rainfall variability. Frances Baard and John Taolo show higher median values (18.05 mm and 16.29 mm, respectively), while Namakwa, Pixley, and ZF Mgcawa have much lower medians, reflecting consistently low rainfall.

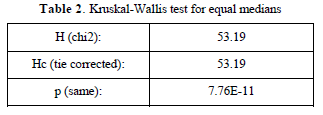
The Kruskal-Wallis test shown in Table 2, was conducted to assess whether median precipitation levels significantly differ among the five district municipalities in the Northern Cape: Frances Baard, John Taolo, Namakwa, Pixley, and ZF Mgcawa. Given the non-normal distribution of precipitation data, as established in Table 1, this non-parametric test was employed to determine if the observed differences in rainfall medians across districts were statistically significant. The test produced a chi-square value (H) of 53.19, indicating a substantial degree of variation in precipitation distributions among the districts. A higher H-value suggests greater differences between the median rainfall values of the respective regions. The tie-corrected statistic (Hc) was also 53.19, confirming that tied ranks did not affect the results. The key finding is the p-value of 7.76 x 10⁻¹¹ (< 0.001), which strongly indicates that the differences in precipitation medians across the five districts are statistically significant. This result confirms that rainfall levels are not uniformly distributed, reinforcing the disparities observed in Table 1. The significant variation indicates that certain regions, such as Frances Baard and John Taolo, experience markedly different precipitation patterns compared to Namakwa, Pixley, and ZF Mgcawa. The findings suggest that precipitation patterns in the Northern Cape are highly heterogeneous, necessitating region-specific approaches to water resource management, agricultural planning, and climate adaptation strategies. The presence of statistically significant differences in rainfall distribution implies that a uniform policy for all districts may be ineffective. Instead, targeted interventions tailored to each district’s unique precipitation characteristics are recommended to ensure sustainable water management and disaster risk mitigation.
Figure 2 presents boxplots illustrating the distribution of precipitation data across the five district municipalities in the Northern Cape: Frances Baard, John Taolo, Namakwa, Pixley, and ZF Mgcawa. These boxplots provide a visual representation of central tendency, dispersion, and potential outliers in the precipitation dataset. The presence of outliers, especially in Frances Baard and John Taolo, highlights extreme rainfall events that deviate significantly from the typical precipitation range. Finally, Figure 2 highlights significant spatial heterogeneity in precipitation patterns within the Northern Cape.
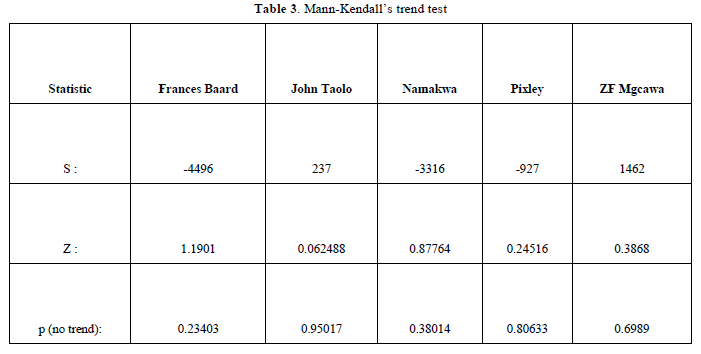
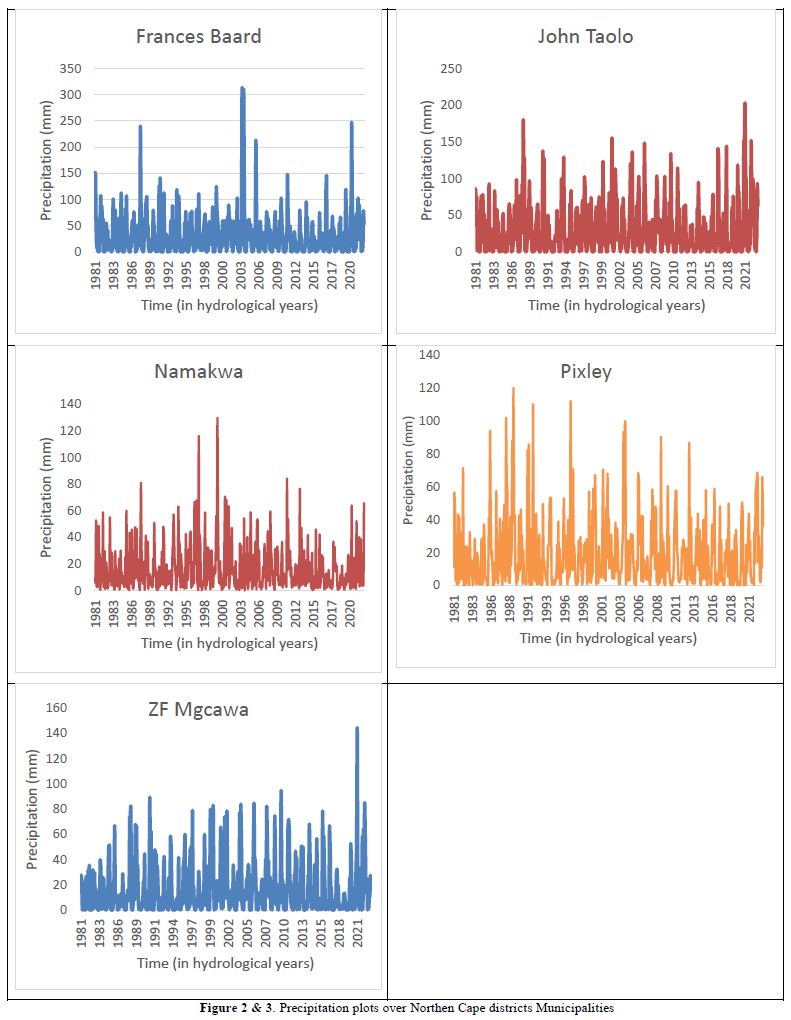
The analysis of precipitation trends in the Northern Cape was conducted using visual representations in Figure 2 and statistical testing in Table 3. The precipitation plots in Figure 3 illustrate seasonal variations and fluctuations in rainfall levels across Frances Baard, John Taolo, Namakwa, Pixley, and ZF Mgcawa. The plots highlight notable disparities, with Frances Baard and John Taolo exhibiting more pronounced fluctuations, while Namakwa, Pixley, and ZF Mgcawa display relatively stable precipitation patterns with fewer extreme rainfall events. Extended dry periods are evident in several districts, particularly Namakwa and Pixley, where rainfall remains consistently low. Frances Baard demonstrates substantial peaks but also includes intervals of reduced precipitation, suggesting rainfall unpredictability and potential drought risk.
To statistically evaluate trends, the Mann-Kendall test was applied, with results presented in Table 3. The trend direction, as indicated by the S statistic, was negative for Frances Baard (S = -4,496), Namakwa (S = -3,316), and Pixley (S = -927), suggesting a potential decline in precipitation. Conversely, John Taolo (S = 237) and ZF Mgcawa (S = 1,462) displayed positive values, indicating a potential increase in rainfall over time. However, significance testing revealed that none of these trends were statistically significant, as all p-values exceeded the conventional threshold of .05. The highest p-value was observed in John Taolo (p = .950), confirming an absence of discernible precipitation trends in this district. Frances Baard (p = .234) and Namakwa (p = .380) had relatively lower p-values, though still not significant, suggesting that observed decreases in rainfall do not constitute a definitive trend. Pixley (p = .806) and ZF Mgcawa (p = .699) also exhibited non-significant p-values, reinforcing the conclusion that precipitation changes are likely due to natural fluctuations rather than an ongoing long-term trend. The findings from Figure 2 and Table 3 complement each other in understanding precipitation dynamics in the region. While the precipitation plots visually suggest potential variations in rainfall patterns, the Mann-Kendall test results confirm that these variations do not meet statistical significance criteria. The slight negative trends in Frances Baard and Namakwa, as indicated by the Mann-Kendall test, align with the fluctuations observed in Figure 2, where these districts demonstrate notable rainfall variability. However, the lack of statistical significance across all districts indicates that precipitation levels do not exhibit a definitive increasing or decreasing pattern over time. The absence of significant trends suggests that precipitation in the Northern Cape remains highly variable, requiring continued monitoring to assess potential long-term climatic shifts. The observed negative values in Frances Baard and Namakwa may indicate a potential risk of decreasing rainfall, though further longitudinal analysis is needed to confirm the persistence of these trends. Given the high variability seen in Figure 3, particularly in Frances Baard and John Taolo, adaptive water management strategies should be implemented to mitigate uncertainty in rainfall patterns.
CONCLUSION AND RECOMMENDATIONS
The study’s findings showed significant spatial disparities in precipitation across the Northern Cape, indicating that Frances Baard and John Taolo experience relatively higher mean rainfall, whereas Namakwa and ZF Mgcawa consistently exhibit low precipitation levels. Despite the absence of statistically significant long-term declines in annual rainfall totals, the increasing variability characterized by prolonged dry spells and extreme rainfall events highlights the growing unpredictability of precipitation within the region. These results correspond with the prevailing understanding of the Northern Cape’s arid and semi-arid climate, where rainfall is inherently scarce and highly variable. The description of the study area revealed that the province receives less than 400 mm of rainfall annually, with certain districts receiving as little as 50 mm. Historical records indicate fluctuations between wet and dry periods; however, the rising frequency of extreme events observed in this study aligns with concerns articulated in prior literature regarding more erratic weather patterns associated with changing climatic conditions. However, the results did not confirm a significant downward trend in precipitation, which diverges from some regional projections that anticipate a gradual reduction in rainfall across semi-arid zones.
The results of the Mann-Kendall trend test revealed slight negative trends in Frances Baard and Namakwa, although these trends were not statistically significant, thereby emphasizing the necessity for ongoing monitoring rather than hastily drawing conclusions about long-term decline. The high variability in rainfall, as indicated by interquartile ranges and skewness values, suggests an increase in extreme weather events rather than a consistent decrease in total precipitation. This pattern is consistent with findings in the study area description, which notes that the climate of the Northern Cape is influenced by both summer and winter rainfall systems, resulting in distinct regional variations. The observed fluctuations in rainfall patterns raise concerns regarding agricultural sustainability, particularly for smallholder farmers who rely on rain-fed agriculture and livestock grazing. The study’s results highlighted the vulnerability of farming systems to unpredictable precipitation, aligning with prior research that documents the impacts of prolonged droughts on livestock numbers and grazing conditions. However, while some research studies suggest a decline in the number of rainy days, accompanied by an increase in heavy rainfall events, the results from this study do not provide strong statistical evidence of such a trend across all districts, indicating that localized variations may be more pronounced than broader regional trends.
In light of these findings, targeted interventions are necessary to enhance resilience against precipitation variability. Water resource management strategies should prioritize the expansion of irrigation infrastructure to mitigate the effects of erratic rainfall, particularly in drier districts where groundwater extraction remains the primary source of water for agricultural activities. Investments in rainwater harvesting systems can improve water availability for farmers, thereby reducing dependency on seasonal precipitation. The study area’s reliance on intermittent rivers and limited groundwater supplies necessitates strengthening groundwater monitoring to ensure sustainable extraction, particularly in districts such as Namakwa, where the prevalence of dry spells requires alternative water sources. Prior literature emphasizes the importance of integrated water management strategies in arid regions, and the study’s findings reinforce the need for adaptive approaches to water conservation. Unlike regions with consistent rainfall that permit large-scale surface water storage, the Northern Cape necessitates a combination of localized rainwater harvesting, groundwater recharge, and efficient irrigation systems to sustain agricultural activities amidst increasing variability.
Adaptive agricultural policies should focus on promoting drought-resistant crops and water-efficient farming techniques, ensuring that productivity remains stable despite fluctuations in precipitation. Farmers in the Northern Cape, particularly in areas with heightened variability, should receive training in conservation agriculture, encompassing minimum tillage, agroforestry, and soil moisture retention techniques. The description of the study area highlights the significance of livestock farming, particularly sheep and goats, which dominate agricultural practices due to their resilience in semi-arid conditions. However, the findings indicate that increasing rainfall variability may introduce new challenges for these adapted farming systems. Literature suggests that shifts in grazing patterns and declining pasture quality due to erratic precipitation can lead to overgrazing and land degradation, exacerbating the vulnerability of pastoral communities. The findings support the argument that sustainable livestock management, including rotational grazing and supplemental feeding strategies, is essential for maintaining rangeland productivity amidst growing climate uncertainty.
The necessity of improved climate forecasting and early warning systems is also evident in the study’s results, as precipitation data demonstrate significant year-to-year variability. Literature shows the role of seasonal forecasting in assisting farmers with informed decisions regarding planting and stocking rates; however, access to accurate climate information remains limited for many rural communities. The results reinforce the urgency of enhancing the dissemination of meteorological data through mobile technology, agricultural extension services, and local farmer networks. Strengthening early warning systems will enhance preparedness for extreme weather events, thereby reducing the financial risks associated with sudden droughts or intense rainfall. Additionally, climate risk management strategies, such as insurance schemes tailored for smallholder farmers, should be developed to mitigate economic losses associated with climate variability. The economic vulnerability of smallholder farmers, as indicated by previous drought periods, necessitates structured support mechanisms to ensure financial stability during periods of low rainfall.
Disaster risk reduction measures must also be reinforced to address the increasing frequency of extreme weather events. The findings indicate that rainfall distribution is highly uneven, with significant differences across districts. The study area’s history of recurrent droughts, alongside land degradation concerns highlighted in previous literature, suggests that localized drought response frameworks should be implemented to ensure that each municipality possesses a tailored strategy for managing water shortages and agricultural disruptions. Given the increase in variability, proactive drought relief programs should be integrated into long-term agricultural planning rather than treated as reactive emergency responses. Expanding institutional support for farmers, particularly through access to climate adaptation training and financial assistance, will enhance their capacity to cope with shifting precipitation patterns. Collaborative efforts involving government agencies, research institutions, and farmer organizations will ensure that policies and adaptation measures are informed by empirical data and tailored to district-specific precipitation trends.
The variability in precipitation patterns also necessitates a community-driven approach to climate adaptation, where knowledge-sharing networks play a pivotal role in ensuring sustainable adaptation strategies. Establishing local climate resilience networks will facilitate the exchange of information among farmers regarding adaptive farming techniques, indigenous knowledge practices, and the latest scientific advancements in climate adaptation. Traditional farming techniques, particularly those emphasizing soil moisture retention and sustainable grazing practices, should be integrated with modern climate adaptation strategies to foster a comprehensive approach to resilience. Community participation in climate adaptation planning should be strengthened, ensuring that local farmers and stakeholders contribute to the design and implementation of adaptation measures. Previous research emphasizes the importance of local adaptation initiatives in semi-arid regions, as top-down policy approaches often fail to address site-specific challenges. The findings of this study suggest that while regional-scale adaptation strategies are necessary, localized interventions tailored to district-level precipitation trends will be more effective in fostering long-term resilience.
Future research should incorporate socioeconomic factors into climate adaptation strategies, ensuring that policy interventions align with the economic realities of farming communities in the Northern Cape. The integration of climate resilience into land reform policies and rural development strategies will ensure that emerging farmers have access to the necessary resources to cope with precipitation variability. Furthermore, additional analysis of seasonal precipitation trends will provide deeper insights into the specific months and seasons where rainfall variability is most pronounced, facilitating the development of more targeted adaptation measures. Continuous long-term monitoring of precipitation patterns, particularly in districts exhibiting higher variability, will be critical in identifying emerging trends and refining climate adaptation strategies accordingly. Implementing these policy and practical interventions will enhance the Northern Cape’s capacity to cope with climate variability, safeguard agricultural livelihoods, and ensure long-term water security in a region increasingly characterized by extreme precipitation patterns.


No Files Found


Internationally Accepted
Share Your Publication :