
-
Publish Your Research/Review Articles in our High Quality Journal for just USD $99*+Taxes( *T&C Apply)
Offer Ends On
Publish Your Research/Review Articles in our High Quality Journal for just USD $99*+Taxes( *T&C Apply)
Offer Ends On
Gana A S, Salaudeen M T, Tolorunse K D*, Nmadu J N, Baba K M, Osunde Z D and Okafor J O
Corresponding Author: Tolorunse K D, Department of Crop Production, Federal University of Technology, Minna, Niger State, Nigeria.
Received: July 05, 2022 ; Revised: August 06, 2022 ; Accepted: August 09, 2022 ; Available Online: October 18, 2022
Citation: Gana AS, Salaudeen MT, Tolorunse KD, Nmadu JN, Baba KM, et al. (2022) Hierarchical Cluster Groupings, Principal Component Analysis, Crown Shape and Trunk Surface Characteristics of Shea Trees in Savannah Woodlands of Nigeria. J Agric For Meterol Stud, 1(1): 1-9.
Copyrights: ©2022 Gana AS, Salaudeen MT, Tolorunse KD, Nmadu JN, Baba KM, et al. This is an open-access article distributed under the terms of the Creative Commons Attribution License, which permits unrestricted use, distribution, and reproduction in any medium, provided the original author and source are credited.
Views & Citations
Likes & Shares
Abstract
A diversity study was conducted to look at Shea tree species relatedness in six states (Niger, Kwara, Oyo, Nasarawa, Kogi and Kebbi) of Nigeria. The states are located within the shea belts of Nigeria. A data form was designed based on International Plant Genetic Resources Institutes (IPGRI) descriptors for shea tree. Twenty-two data sets were collected that included trunk characteristics, leaf and fruit characters; non- morphometric characters that included crown shape, growth pattern and fruit taste. A total of 900 trees were studied, however, only 833 were used for analysis because of incomplete data. In each state, 150 trees were considered in three different locations based on Agricultural zones in the states and the total number of locations across the states was 18. Each location had 50 trees. The data collected were subjected to cluster and principal component analysis. Also, bar charts were constructed to define the number of trees in a location that has a particular crown shape and trunk surface characteristics. Results from the states and combined clustering showed that most trees across the states were of similar backgrounds. Trees from individual states showed a high level of similarity by clustering into one group. The percentage range from 50% (Kebbi state) to 96.6% (Oyo). When all the trees from across the states were combined; cluster one had 407 trees with smaller subgroups and were found in the states of Kogi, Kwara and Oyo; this represents about 50% of all the trees. There was a stand-alone tree in clusters 11 and 17 coming from Ilorin south and Nasarawa respectively. The principal component analysis delineated the parameters into five components. The first component explained 92.54% of the total variation among the characters studied. The crown shape characters were classified into six classes with most of the locations having various shapes except elliptical shape. Also, almost all the trees were either rough trunk surface or very rough. This result shows that shea trees in these states have a common origin and the spread might have arisen from a single center of diversity.
Keywords: Shea, Trunk, Crown, Characteristics, Cluster
INTRODUCTION
Shea tree (Vitellaria paradoxa) is a wild deciduous tree that occurred in abundance in Nigeria Savannah agro-ecological zones. The tree has been preserved over the years due to its medicinal, economical and industrial uses. The major product from the shea tree is the shea butter which has been used for ages for cooking and medicinal application for wounds and cuts [1,2].
Shea tree constitutes the principal useful tree in a large area of savanna nearly five thousand kilometers long [3], extending from Senegal to Uganda and Ethiopia [4]. Traditionally, this treasured species provides primary edible vegetable fat to people inhabiting an estimated one million km2 of wooded grassland [5]. Evidence of the utilization of shea butter, and the shea tree itself, dates back about 4000 years to ancient Egypt. However, the modern development of the shea tree as a nutritional and economic resource began in West Africa in the 1950s and has greatly increased in recent years.
Variation exists not only among the populations but also among the individual population of shea tree [6]. High diversity observed in the arid zones provides an opportunity to find and use appropriate plant materials for breeding climate change resilient trees. Diversity studies will enable an easy and quick description of phenotypes. These data will be necessary for gene bank curators and future breeding programmes.
Variability in shea trees is enormous and not yet fully understood. Local people in West Africa have long identified several cultivars based on flowering patterns, fruiting, the sweetness of fruit pulp, size and colour of leaves and fruits. Botanists and explorers also reported this great diversity of shea resources. The current general view is that the genus Vitellaria consists of one species: Vitellaria paradoxa, with two subspecies: Vitellaria paradoxa subspecies paradoxa and Vitellaria paradoxa subspecies nilotica [7]. Fifty- three subspecies of paradoxa occur in the western range of the shea belt extending over 4700 km and covering fifteen countries: Benin, Burkina Faso, Cameroon, Central African Republic, Gambia, Ghana, Guinea, Guinea Bissau, Mali, Niger, Nigeria, Senegal and Togo. Subspecies nilotica occupies the eastern range and is found in four countries: Ethiopia, Sudan, Uganda and the Democratic Republic of Congo. Subspecies nilotica grows at higher altitudes (650- 1600 m) and under cooler temperatures (21-22°C mean annual temperature) than subspecies paradoxa (100-1300 m) elevation and temperature (25-29°C). An additional distinguishing characteristic between the two subspecies relates to butter chemical composition, which has major economic significance. The butter from the western subspecies paradoxa is high in stearic acid, yielding a solid butter, while fat from the eastern subspecies nilotica is dominated by oleic acid, yielding liquid oil [7].
The need to study the diversity of shea trees cannot be overemphasized; it allows the identification of economically important traits for future breeding programs.
MATERIALS AND METHODS
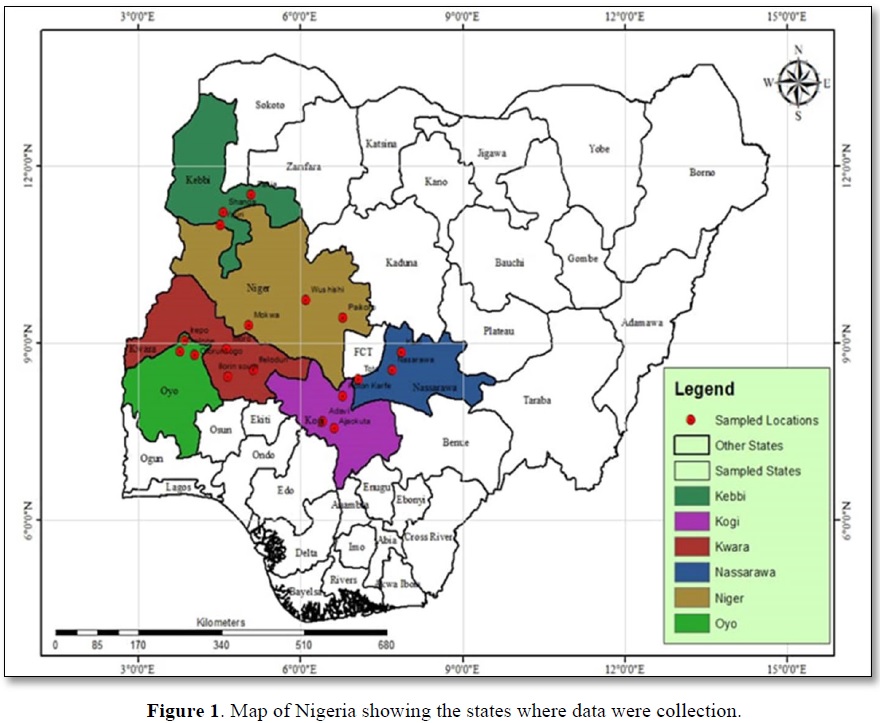
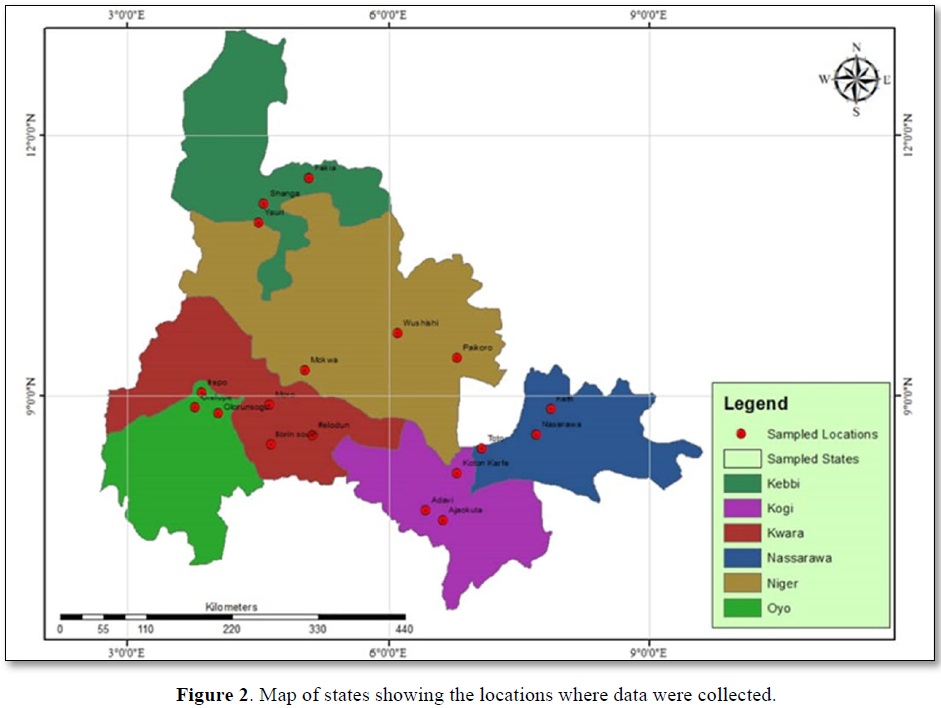
A study of shea tree diversity was conducted in May 2021, at the time when shea tree is at the fruiting period in Nigeria. The study was conducted in six states that cut across the Southern and Northern Guinea savannah agro-ecological zones of the country. The states are Niger, Kwara, Kogi, Nasarawa, Oyo and Kebbi (Figure 1). Figure 2 shows the actual locations the data were collected; there are 18 locations across the six states. A total of Nine hundred (900) trees were studied in the states. In each state, three locations were chosen to represent the Agricultural Development Zones of the states. In each location, fifty (50) trees were randomly selected making one hundred and fifty (150) trees in each state. Twenty-two data sets were collected following the shea tree descriptor of IPGRI [6]. The data collected include trunk height, trunk circumference, trunk surface type, tree crown shape, branching pattern, leaf length, leaf width, leaf blade shape, leaf apex shape, fruit habit, fruit shape and fruit apex type and weight. The data were collected through the use of metric measurements and descriptions based on IPGRI, descriptors. The data collected were subjected to cluster analysis and principal component analysis. The cluster method used was Agglomerative (Complete linkage). Charts were constructed using excel to show the number of trees that have a certain category of crown shape and trunk surface characteristics.


RESULTS
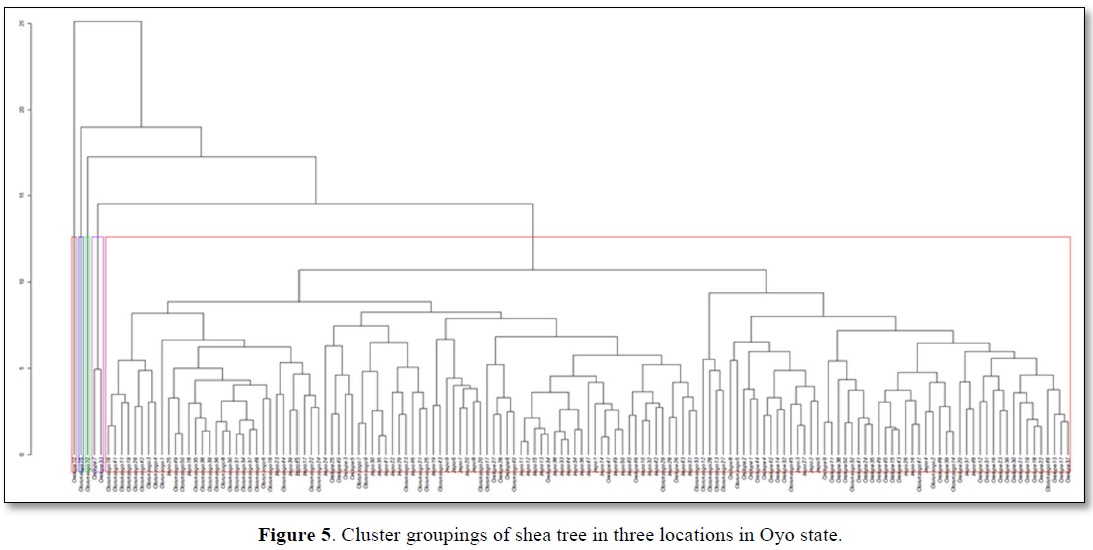
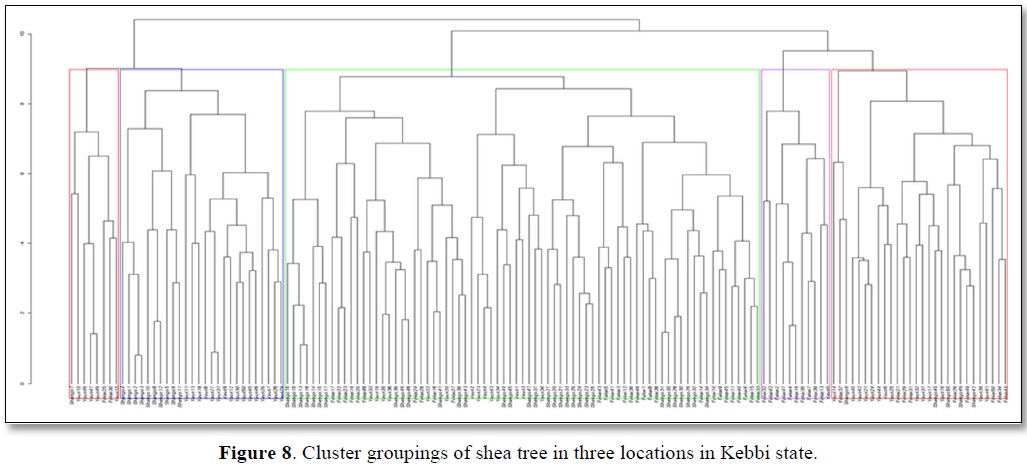
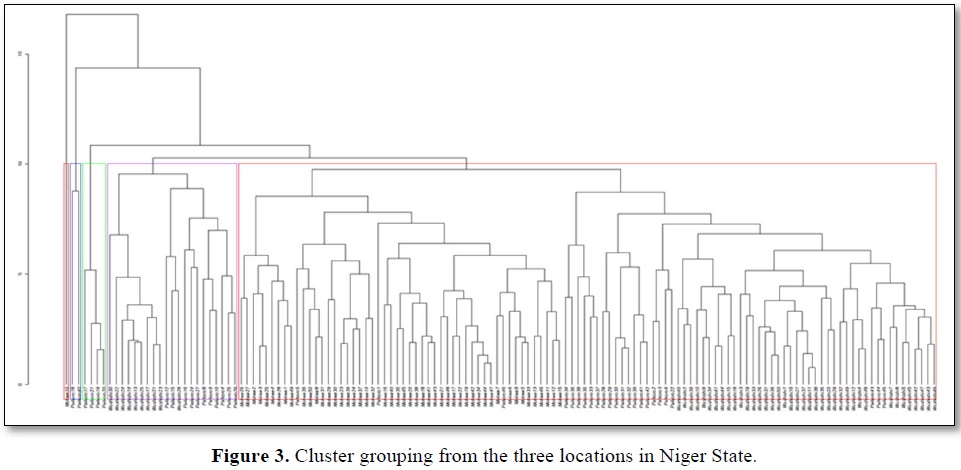
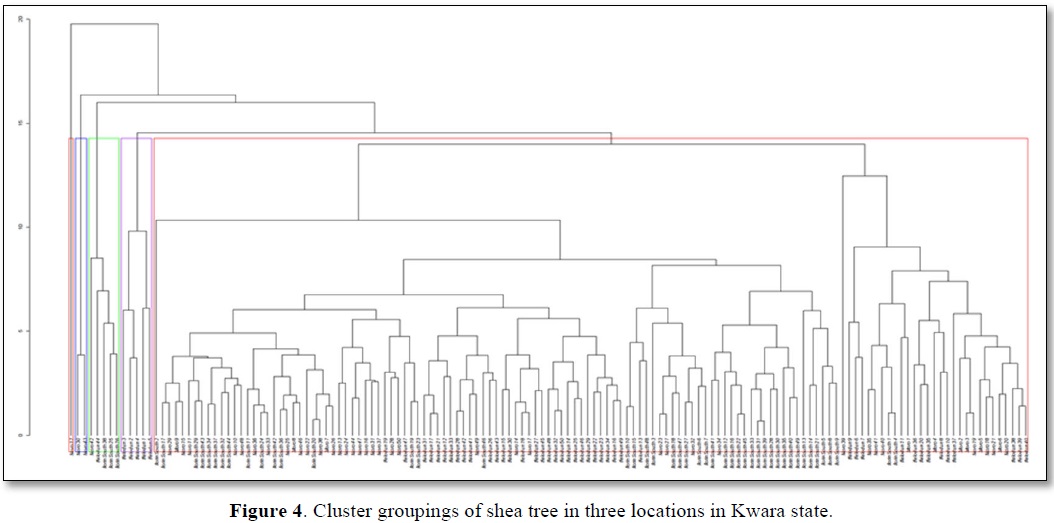
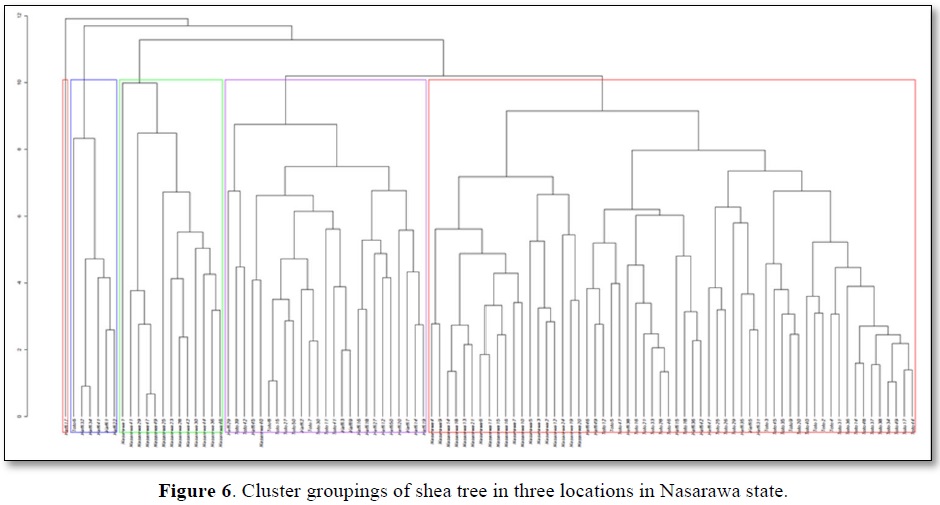
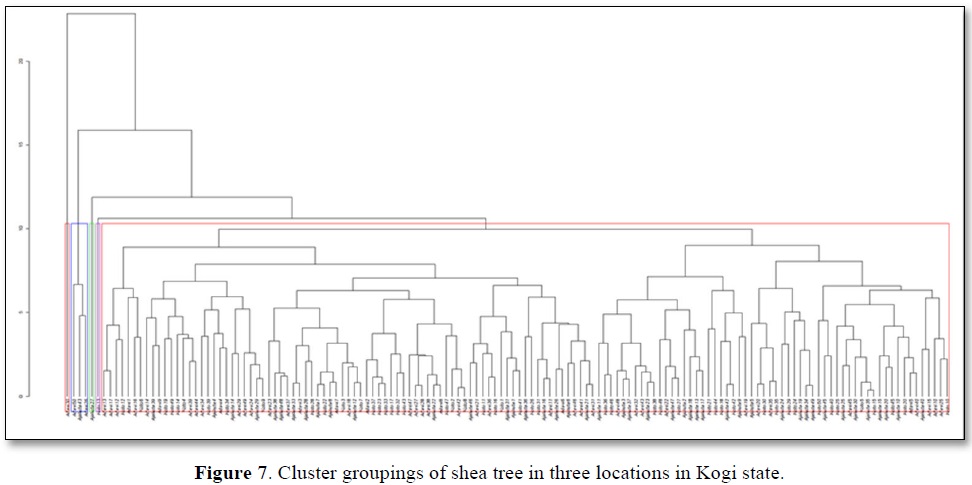
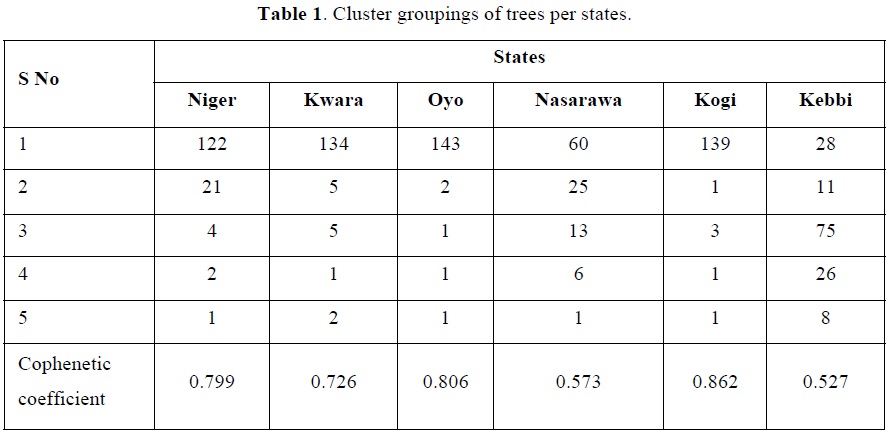
The result in Table 1 and Figures 3-8 are the individual state’s cluster groupings. Results show that in most of the states the trees cluster mostly in one group. In Niger state, of the 150 trees a total of 122 trees were in group 1; this cluster has two large subgroups. Subgroup one has 69 trees while two has 53 trees. Whushishi trees first combine with trees from Paikoro. Trees from Mokwa are mostly in subgroup 2 of cluster one. There is a stand-alone tree from Mokwa which joins others at a high dissimilarity index. The large group represents 81.3% of the trees. In Kwara state cluster one contains three subgroups of 72, 33, and 29 trees making a total of 134 trees. All these trees combined from different locations of the state. However other groups joined to this group at higher dissimilarity index. Cluster one in Kwara is 91.1% of the cluster groups. Result from Oyo shows that the larger cluster one has subgroup with 55, 56 and 32 trees, the trees combined well from different locations. In Nasarawa state of the three locations studied cluster one has 60 trees and no subgroup; other groups have 25, 13, 6 and one trees. Most trees from Nasarawa location are in group one and three. Results from Kogi shows that there is a major cluster that has three subgroups containing 58, 54, and 27 trees. The remaining sub groups had fewer trees. In Kebbi state all the trees from different locations were mixed there was no concentration of trees from one location in one cluster. Cluster three had the highest number of tree (75) and contains two subgroups. This was followed by cluster one with 28 trees. In this state trees were not concentrated in one cluster but there was a fair spread in all the clusters.


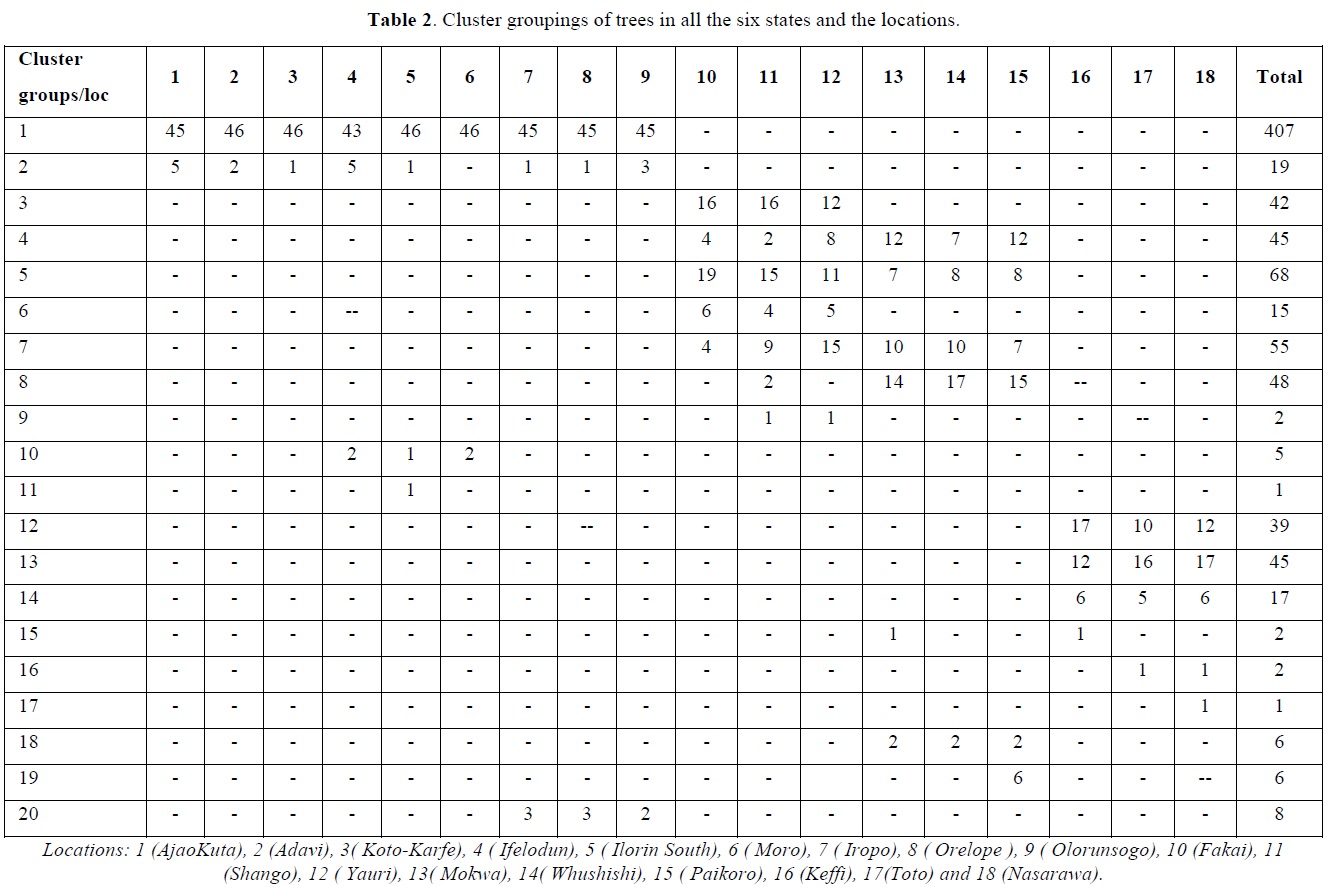
The result of cluster group for the six states is as shown in Table 2; out of the 900 trees studied only 833 trees were used for the clustering because of missing data in some trees and locations. The table shows that cluster one had the highest number of trees; a total of 407 that amounted to about 50% of the total number of trees. All the trees in cluster one are from nine locations of Ajaokuta, Adavi , Koto-Karfi (Kogi State) Ifelodun, Ilorin South, Moro (Kwara State) Irepo, Orelope and Olorunsogo (Oyo State). These three states shared boundary with each other (Figure 1). Cluster three to eight are trees from Niger and Kebbi states which also shared the same boundary. Trees from Nasarawa state are in a far distance in cluster 12, 13 and 14. It is noted that there is high level of commonality of trees from the same states and states that shared boundary with each other. Most of the trees in Nasarawa states are in these three clusters. There is a stand-alone tree in clusters 11 and 17 coming from Ilorin South and Nasarawa respectively. Eight trees from Oyo state shared the last cluster which means they could only be joined to cluster one at a high dissimilarity index especially that most trees from that state are in cluster one. This means these trees and others might have gene outflow from other locations that are far.

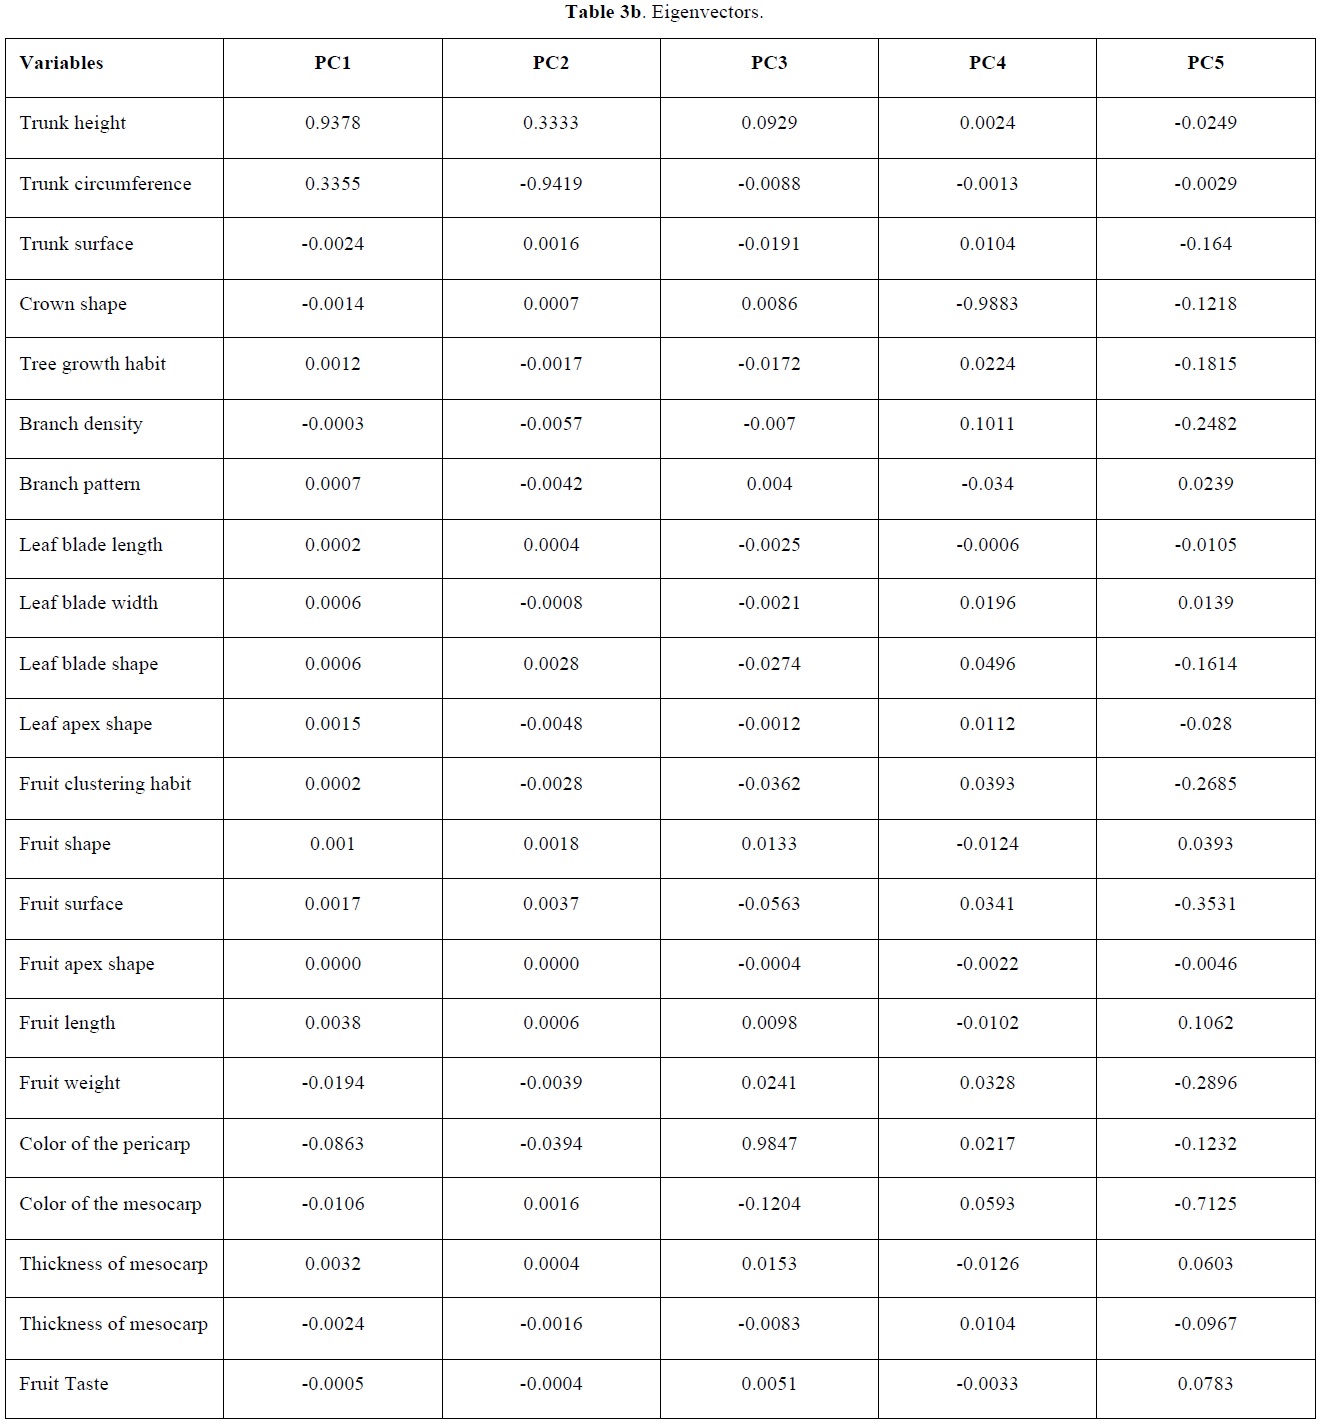
The principal component analysis is as shown in Tables 3a & 3b. Principal component one contributed to most of the variation in the population; it was 92.54%. The other four components contributed little to the variations in the population; the total contribution from the five components is 99. 87%. Almost all the variations were explained by these five components. In the principal component one, trunk height and trunk circumference were the major contributors to variation. Also in principal component two trunk heights contributed more to the variation.
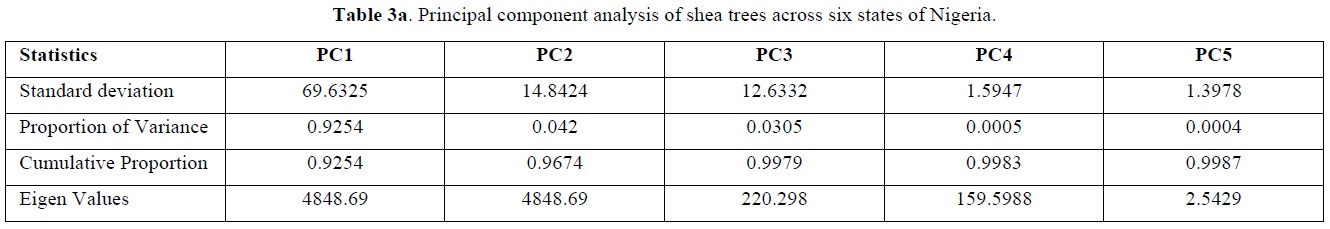

Figure 9 shows the various type of crown shape of shea trees. They could be distinguished into six classes’ base on description of IPGRI [6]. The shapes include pyramidal, broadly pyramidal, spherical, oblong, semi-circular and elliptical. In various locations there were diversities of shapes. Location with the highest pyramidal shape is Mokwa followed by Keffi. For broadly pyramidal shape is Olorunsogo and Moro followed by Shango; while spherical shape is Ilorin south followed by Kotokarfi. The highest oblong shape is Toto followed by Irepo. For semicircle Whushishi has the highest followed by Paikoro and Yauri. Fewer locations had their shapes elliptical with Adai having the highest which is followed by Ajaokuta. This shows that the different crown shapes are not localized into a particular location. Each location has the diversity for the crown shape.
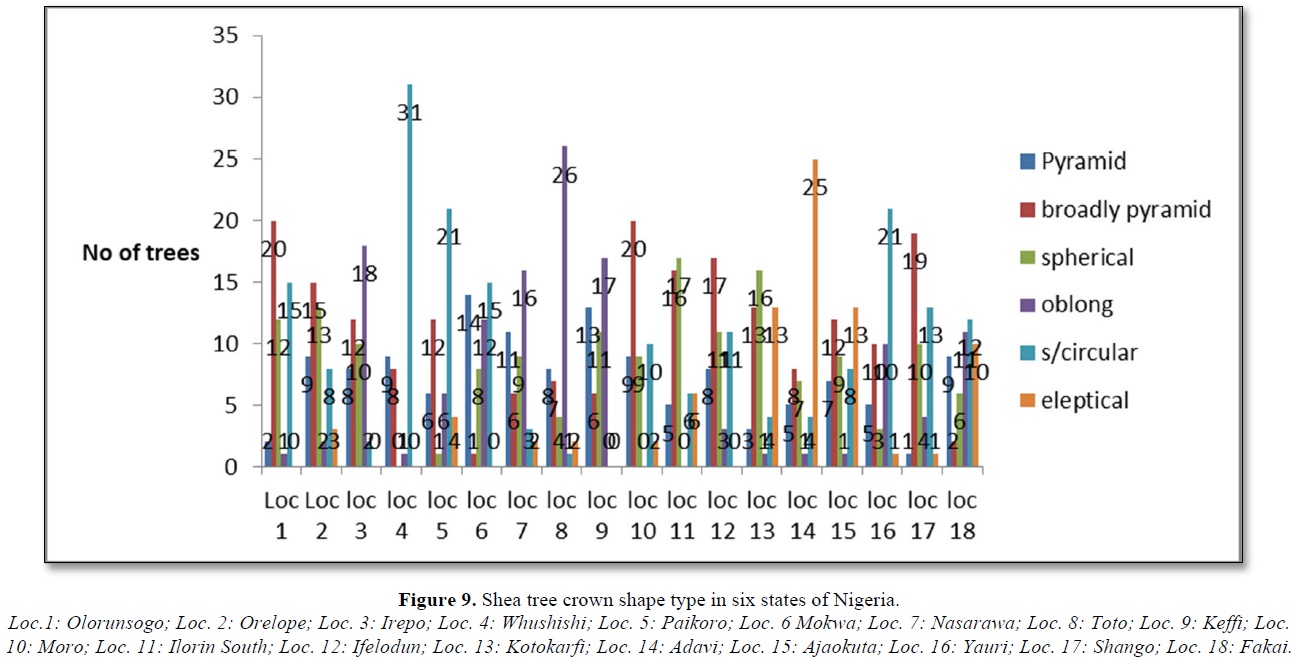
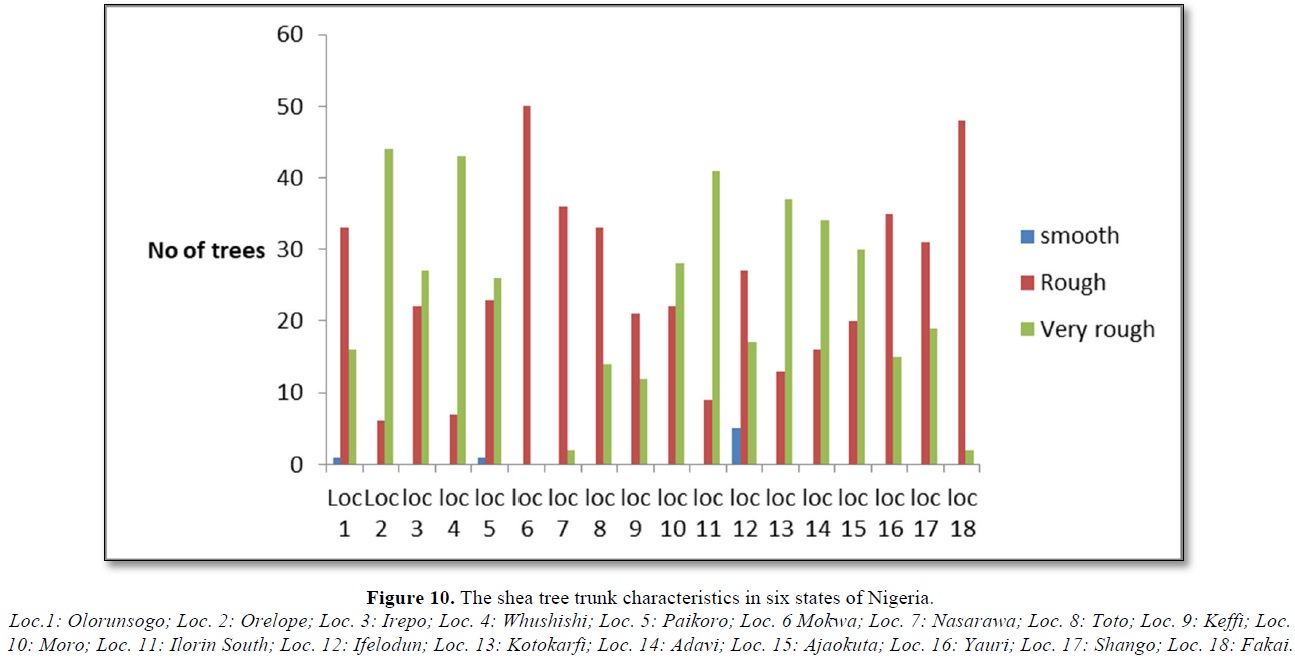
Figure 10 shows the variation in trunk surface outlook. This is categorized into three groups; the smooth, rough and very rough surface. Most of the trees are either rough or very rough. In all the locations only seven trees were found to have smooth surface and five of them are in Ilorin south.
DISCUSSION
Result from the cluster groupings within the states and when the six states are combined show the diversity of the tress in all the locations and the states. Those trees that formed near neighbor will have genetic affinity with each other than those at a distance. There was no distinct separation across the states. Lovett and Haq [1] also revealed that cluster and Principal component analysis did not show the presence of any clearly recognizable groups. Widely distributed but overlapping groups were revealed when only leaf and seed quantitative variables were used. According to the authors; Isozyme and multivariate morphology analysis showed similar but weak geographical separation pattern.
All these shows that the shea tree might have evolved from a narrow genetic base and distribution either within or out of the states might have occurred from few trees or single dominant tree. Genetic flow might have existed either by man or birds that feed on shea tree and carry it over a long distance. The similarity of these threes in their near neighbor states indicates a common origin. Birds are known to carry shea tree fruits from one location to the other. The evolvement of shea tree into different locations might have risen from one center of diversity. Cultivation practices and activities of men could have caused the spread, however since the trees are left in the wild bush burning and other practices like pruning of leaves to feed animals could have affected the morphological differences in the trees. Shea tree is highly primed for fuel wood, although it can easily coppice and grow to another tree after being cut, this practice will definitely affect the morphology of the tree. The genetic similarity of the trees from these states is high. This may also proof that the point of diversity of shea tree in the study locations may be the same. The principal component analysis shows that the variations were contributed by few parameters. Lovett and Haq [1] in their work obtained 99.47% cumulative variance of the study conducted in Ghana similar to the result of this study of 99.87%.
There is no peculiarity of a particular crown shape type for a location. All crown shape types could be noticed in all locations. Most shea trees in all the locations has rough and very rough trunk surface. Shea trees are known for having rough trunk surface; this help to protect the plant against bush fire which is common in the savanna woodland. The rough nature of the surface allows the tree to survive the vagaries of unfavorable climate condition for a long time. Trunk character could be a breeding objective for the improvement of shea tree in savannah woodlands.
CONCLUSION
The shea trees from the six states do not show distinct groups as the clustering revealed that trees from states that share boundary cluster together. There are mixtures of trees from the same location within the states and when all the states were combined together.
ACKNOWLEDGEMENT
The authors wish to acknowledge Tertiary Education Trustfund (TETFUND) for providing the grant for the study and Federal University of Technology, Minna Management for the enabling environment to undertake the study.
DECLARATION STATEMENTS
This is to declare that there is no conflict of interest among authors.


REFERENCES
No Files Found


Internationally Accepted
Share Your Publication :