
-
Publish Your Research/Review Articles in our High Quality Journal for just USD $99*+Taxes( *T&C Apply)
Offer Ends On
Publish Your Research/Review Articles in our High Quality Journal for just USD $99*+Taxes( *T&C Apply)
Offer Ends On
Ahmed N Ghanem*
Corresponding Author: Ahmed N Ghanem, MD (Urology), FRCS Ed, Mansoura University, Faculty of Medicine, Egypt, Retired Consultant Urologist Surgeon & Independent Investigator No1 President Mubarak Street, Mansoura 35511, Egypt.
Received: February 17, 2021 ; Revised: March 08, 2021 ; Accepted: March 11, 2021
Citation: Ghanem AN. (2021) Capillary Ultrastructure Anatomy and Physiology: What is Known, what is Unknown or Missing, what is Wrong, and What is New? J BioMed Adv Clin Res, 1(1): 1-16.
Copyrights: ©2021 Ghanem AN. This is an open-access article distributed under the terms of the Creative Commons Attribution License, which permits unrestricted use, distribution, and reproduction in any medium, provided the original author and source are credited.
Views & Citations
Likes & Shares
Abstract
This article summarizes what is already known about the capillary ultrastructure anatomy and physiology that includes one wrong physiological law of Starling and two misconceptions on capillaries cross section area and blood speed in its lumen. It identifies missing data such as the number and diameters of capillaries branching from the terminal arteriole, and the speed of blood at the arterial and venous ends. It also summaries the evidence on new knowledge on capillary physiology namely the hydrodynamic of the porous orifice (G) tube built on a scale to capillary ultrastructure anatomy of pre-capillary sphincter and intercellular slits pores. It proves Starling’s law wrong and provide its correct replacement. The Tree Branching Law (TBL) corrects both misconceptions on capillaries cross-section area being larger that the aorta and capillary blood speed is “very slow”. The TBL proves that the cross-section area of all capillaries is less than that of the aorta, and the blood speed in capillary is faster than generally received. The G tube’s magnetic field like hydrodynamics is the correct replacement for Starling’s law on the capillary-ISF transfer. This new capillary-ISF transfer allows for fast efficient function that meets cells and tissue demands at rest and during strenuous exercise.
Keywords: Capillary Physiology, Capillary Blood Speed and Pressure, Starling’s Law, Hydrodynamics, The Porous Orifice G Tube, Tree Branching Law
INTRODUCTION
What is known about the capillary?
The vascular capillary is the microtubule that connects an arteriole to venule. It is functionally responsible forth passage of gases and nutrients from blood into the body cells. It is exceedingly small, measuring 5-10 micrometers (µm) in diameter, only allows red blood cells (RBCs) to pass through one cell at a time. Walls are made of semi-permeable membrane to allow transport of gases and nutrients into and out of the blood.
Anatomical Structure of Capillaries [1]
Capillaries are composed of a thin layer of epithelial cells and a basal lamina, or basement membrane, known as the tunica intima. There is also an incomplete layer of cells, that partially encircles the epithelial cells, known as pericytes. Microvascular pericytes regulate blood pressure in the capillaries through contraction. This improves the efficiency of exchange between the blood in the capillary and the tissue surrounding it. Blood flow into the capillaries is controlled by precapillary sphincters, smooth muscle bands that wrap around metarterioles.
The purpose of capillaries is to play the central role in the circulation, delivering oxygen in the blood to the tissues, and picking up carbon dioxide to be eliminated. They are also the place where nutrients are delivered to feed all the cells of the body.
Structure
Capillaries are very thin and are composed of only two layers of cells-an inner layer of endothelial cells and an incomplete outer layer of epithelial cells. Surrounding this layer of cells is the basement membrane, a layer of protein surrounding the capillary. It has been estimated that there are 40 billion capillaries in the average human body. Also, it is postulated that if all the capillaries in the human body were lined up in single file, the line would stretch over 100,000 miles.
Number of Capillaries Varies by Tissue Type
The number of capillaries in a tissue can vary widely. Certainly, the lungs are packed with capillaries surrounding the alveoli to pick up oxygen and drop off carbon dioxide. Outside of the lungs, capillaries are more abundant in tissues that are more metabolically active.
TYPES OF CAPILLARIES
There are three primary types of capillaries in the circulation:
Function
The capillaries are responsible for facilitating the transport and exchange of gases, fluids, and nutrients in the body. While the arteries and arterioles act to transport these products to the capillaries, it is at the level of capillaries where the exchange takes place.
The capillaries also function to receive carbon dioxide and waste products that are then delivered to the kidneys and liver (for wastes) and the lungs (for exhalation of carbon dioxide).
Gas Exchange
In the lungs, oxygen diffuses from the alveoli into capillaries to be attached to hemoglobin and be carried throughout the body. Carbon dioxide (from deoxygenated blood) in turn flows from the capillaries back into alveoli to be exhaled into the environment.
Fluid and Nutrient Exchange
Likewise, fluids and nutrients diffuse through selectively permeable capillaries into the tissues of the body, and waste products are picked up in the capillaries to be transported through veins to the kidneys and liver where they are thus processed and eliminated from the body.
Blood Flow Through Capillaries
Blood flow through capillaries plays such an important part in maintaining the body. The speed of flow is thought “very slow” to allow for the slow “perfusion balance” between the blood in lumen and the surrounding interstitial fluid (ISF) space.
Capillary beds are regulated through autoregulation, so that if blood pressure would drop, flow through the capillaries will continue to provide oxygen and nutrients to the tissues of the body. With exercise, more capillary beds are recruited in the lungs to prepare for an increased need for oxygen in tissues of the body.
The flow of blood in the capillaries is controlled by precapillary sphincters. A precapillary sphincter is the muscular fibers that control the movement of blood between the arterioles and capillaries. It has an important function in regulating the blood flow speed and pressure in the capillary.
Capillary Microcirculation
Regulation of fluid movement between the capillaries and the surrounding ISF tissues is determined by the balance of two forces: the hydrostatic pressure and osmotic pressure. These are known as Starling’s forces proposed as hypothesis in 1886 [2] and 1896 [3] which later became Starling’s law with equations.
On the arterial side of the capillary, the hydrostatic pressure (derived from the arterial pressure) is high. Since capillaries are "leaky" this pressure forces fluid and nutrients against the walls of the capillary and out into ISF space and tissues, higher near the inlet.
On the venous side of the capillary, the hydrostatic pressure has dropped significantly. At this point, it is the osmotic pressure of the fluid within the capillary (oncotic pressure) that draws fluids back into the capillary.
1. Current engineering microvascular and capillary ultrastructure anatomy, and correct physiology on pressure and RBCs speed or capillary Blood speed (CBS)
Fletcher [4] stated: “The body’s vascular network is organized in hierarchal, tree-like structures with complex and diverse branching configurations designed to efficiently exchange oxygen, nutrients, and waste within and between tissues throughout the body. Large arteries (>6 mm) carry oxygenated blood to smaller arteries (1-6 mm), and then to the arteriolar network (100-1000 µm), and finally into capillary beds (10-15 µm). Tissue engineers have developed numerous methods to fabricate functional vessels with diameters ranging from 1 to 10 mm. The microvasculature is composed of a dense, high-aspect ratio network of capillaries (10-15 µm) located within
2. A Brief Historical perspective on landmark articles on Starling’s hypothesis
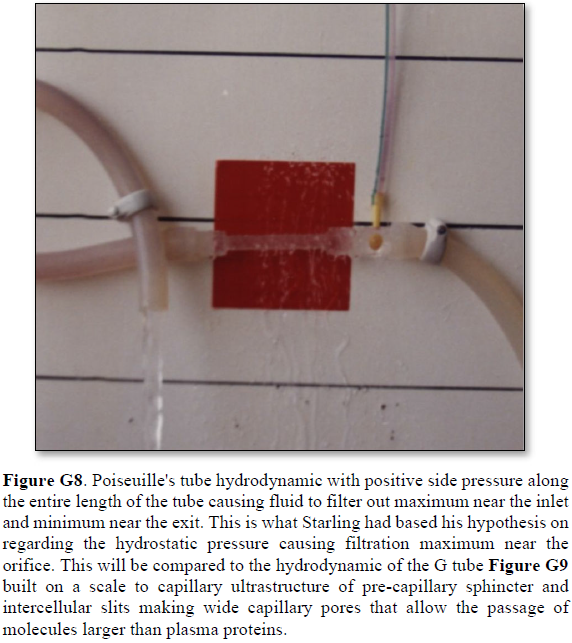
The history of capillary haemodynamics started with Staring’s reports in 1886 [2] and 1896 [3]. The two main forces of Starling’s hypothesis are: the hydrostatic pressure causing filtration maximum near the inlet as based on Poiseuille’s work in strait uniform brass tube. The opposing force of oncotic (osmotic) pressure of plasma proteins (albumin) causes absorption. A balance between these two force is presumed to cause a state of “perfusion” balance between the capillary and ISF space. The two similar minor opposing forces in the ISF space are disregarded in this discusion. Landis [6] reported his article in 1927 . He measured the hydrostatic pressures at the arterial and venous ends of the capillary and reported 32 and 12 mmHg, respectively.
Chambers and Zeweifach [7]wrote: “The muscular component are narrower than most of the true capillaries in the bed”, indicating the presence of precapillary sphincter was known then. Pappenheimer and Soto-Rivera [8] reported their research results in 1948. After that Starling’s hypothesis was transformed into a low with equations.
In fairness to Professor Starling, who was a great physiologist, these authors [9,10] correctly wrote: “When Starling proposed his hypothesis in 1896 [3], on the capillary interstitial fluid (ISF) transfer and oedema formation he never wrote equations nor proposed a law.” Starling’s hypothesis was transferred into a law after Pappenheimer and Soto-Rivera report in 1948 [24] despite having serious experimental error. The ultrastructure anatomy of the capillary of the precapillary sphincter and the inter-cellular cleft pores were discovered in 1967, by Rhodin [11] and Karnovesky [12] respectively.The wide intercellular capillary pores nullify the oncotic pressure in vivo. Multiple criticisms of Starling’s hypothesis brought about RSP as an attempt for repair [9,10]. Guyton and Coleman in 1968 reported the pressure of the ISF space in a subcutaneously implanted capsule to be -7 cm water [13] that cannot be explained by Starling’s forces.
Despite reporting 21 reasons affirming Starling’s law wrong and the correct replacement is the hydrodynamics of the G tube [14-17], Starling’s law has remained accepted till curent time of writing this report despite being proved wrong [18,19]. There are hard critics who still believe the Revised Starling’s Principle (RSP) is the saviour of Starling’s hypothesis [10,11]. Professor Hahn has recently criticized RSP in an article titled: “The Extended (Revised) Starling principle needs clinical validation.” I have put my mark on this debate by reporting an article titled: “Revised Starling’s Principle (RSP): a misnomer as Starling’s law is proved wrong.” [6]. I agree with Hahn et al, but I think that their call for further clinical validation of RSP is unnecessary. I predict and warn authors that further clinical validation of RSP or any related research will prove to be total waste of energy, money, efforts, and time. The authors have already regretted using the word “Revised” and introduced “Extended” instead, but their regret will be greater when they realize that both Starling’s law and RSP are wrong.
What is unknown about the capillary?
In 1983, Mattfeldt and Mall [5] reported on ultrastructure dimensions of capillaries: “The ‘ideal’ capillary is a tube connecting an arteriole to a venule. According to Crogh’s model it is a perfect, anisotropic, straight, and unbranched tube with a diameter of 7-18 µm.” As the capillaries are actually partially anisotropic, curved, branching cylinders with variable cross‐sectional area, a geometrical bias arises from the model‐reality discrepancies”.
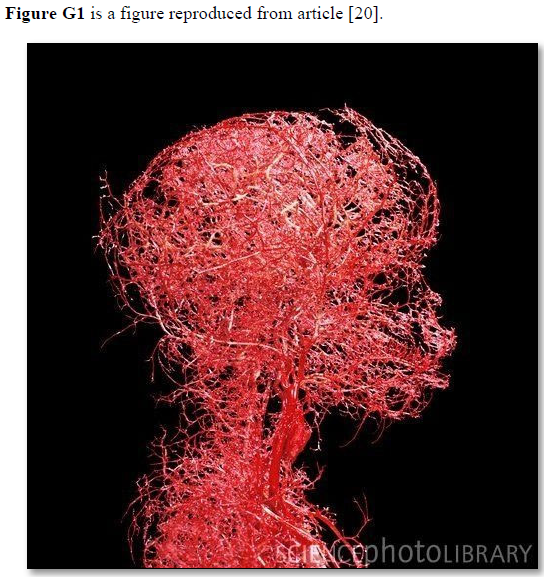
Based on data and diagram reported by Fleisher [4] reproduced here as (Figure G1) the diagram is a representation of the structure of the capillaries, but lacks the engineering precise measurements on diameters, length, and number of capillaries and branches with diameters measurements also. Ideally if feasible an actual photograph with the mentioned measurements is better. The terminal arteriole and its capillaries’ pressure and RBCs speed also need to be determined in future studies at both the arterial and venous ends. Such data when available allow an actual estimation of the number and cross section areas of all capillaries in relation to the aorta in a human or animal. This summary of the currently missing or unknown data on capillary physiology is so vital for understanding the hydrodynamics of the capillary physiology that it should direct future research. Also, for no obvious reasons the authors swabbed the red color of arteriole with the blue color of venule. The original and natural color of red should be attributed to the arteriole as it contains red oxygenated blood. The blue color should be attributed to the venule as it contains blue deoxygenated blood.
Syed [20] reported relevant and important data on the aorta: “The mean diameter of the ascending aorta (Asc Ao) in men was 2.91±0.40 cm, compared with 3.34±0.34 cm in prior studies. The mean diameter of Asc Ao in women was 2.70±0.36 cm, compared with 2.98±0.34 cm in prior studies.”. The estimated number of capillaries in adult human has a huge range between 300 million and 40 billion capillaries. Considering the first number as more realistic and a capillary diameter of 10 µm the total cross section area of the capillaries can be calculated and compared to the aorta. My calculation revealed a cross section area of the aorta is 6.6 cm2 and the sum of total cross section area of all capillaries is 2.375 cm2. That is considerably less not more than the aorta.
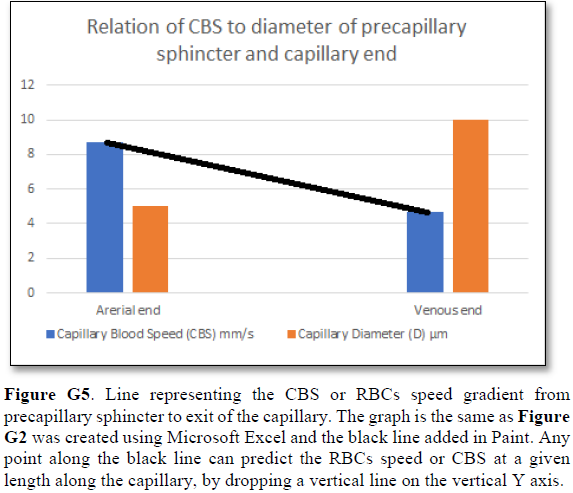
The reported RBCs speed or CBS is generally received as being “very slow”. The speed varies from capillary to another and from report to another both in humans [21], and in rats [22-25]. Such variation is expected even in the same capillary from point to another as there is a speed gradient from the precapillary sphincter with a speed of 8.7 mm/s to exit of the capillary with a speed of 4.7 mm/s [22]. What matters most here is the speed gradient along the wide lumen of the capillary tube (wider than the precapillary sphincter of 5 µm in diameter, but not the feeding arteriole).
Ivanov [25] reported: “The mean linear red cell velocity for 100 cerebral capillaries 2-5 μm in diameter was found to be 0.79 ± 0.03 mm/sec. In the temporalis muscle the velocity was equal to 1.14 ± 0.04 mm/sec in 123 capillaries and 2.43 ± 0.08 mm/sec in 34 arterioles and pre-capillaries not more than 5 μm in luminal diameter”.
Ishikawa [23] reported: “Average RBC velocity in the capillary is between 0.73 and 0.99 mm/s”.
Guevara [24] reported: “The mean centerline RBC velocity in normal rats varied between 1.0 and 9.0 mm/s (most of the measurements were taken in vessels ranging between 20 and 80 µm in diameter). As the diameter of the pial artery becomes smaller, the blood flow rate (pi x (diameter/2)2 x (mean centerline velocity/1.6)) tends to become smaller”.
Stücker [21] reported on Resting capillary Blood Velocity in humans: “The mean capillary blood velocity (CBV) rest was 0.47 mm/sec (SD ± 0.37 mm/sec, range 0.14 to 0.93 mm/sec). The average intraindividual difference between max rCBV and min rCBV was 0.30 mm/sec (SD ±0.18 mm/sec). The maximum difference between the capillaries of a single subject ranged up to 0.63 mm/sec”.
Stücker [21] also observed: “Another reason for slow CBV may be that the velocity was assessed in the venous limb of the capillary loop, whereas usually CBV is lower than the velocity in the arterial limb, as in our device the venous and arterial capillary limbs of the capillary loop is sometime relatively hard to distinguish.” This observation affirms the speed gradient of RBCs speed along the capillary from the sphincter to the exit.
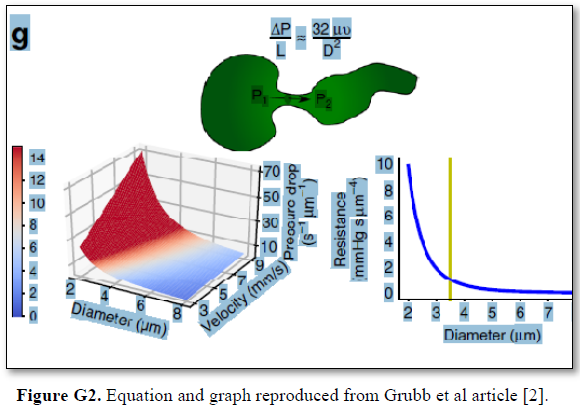
Grubb [22] did not do direct measurements of CBS or RBCs speed and pressure neither at the arterial nor the venous end of the capillary. The values reported by Grubb (2020) [8] are derived from formulae above the graph (Figures 2g and G2) where they stated in the legend: “At rest, the average RBC velocity through precapillary sphincters was 8.7 ± 0.6 mm/s (Fig. 4c), significantly higher than for the bulb (3.6 ± 0.6 mm/s) and the first order capillary (4.7 ± 0.6 mm/s), but correlated with the relative differences in the resting diameters of the vessel segments”.
Off course the RBCs speed is correlated with the diameters of the precapillary sphincter and that of the capillary lumen specifically at exit. The remaining wide diameter part of the tube has different RBCs speed according to the gradient between the high figure at precapillary sphincter and the low figure at the exit of the capillary. This is related to the fluid jet’s dynamic diameter that changes from 5 µm as rest diameter of the precapillary sphincter at inlet to 10 µm as the diameter of the capillary tube. It is the diameter of the jet in the lumen of the wide section tube that operates in the equation along the whole length of the wide section of the capillary.
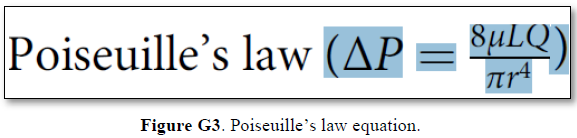
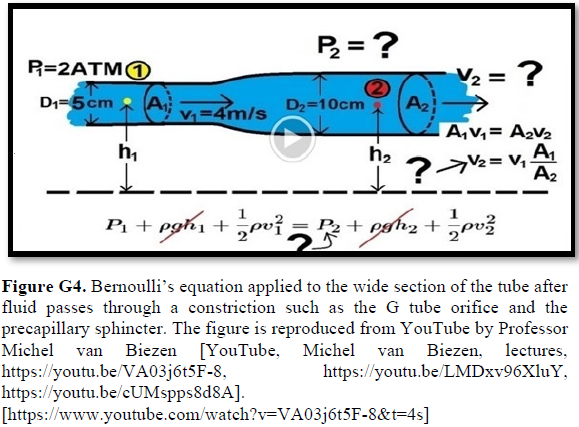
Grubb [22] derived the above values from the equation show in (Figures 2g and G2). that is derived from Poiseuille’s law (Figure G3) or perhaps from Bernoulli’s equation, where V1A1=V2A2. So, V2=V1 A1/A2 (Figure G4).
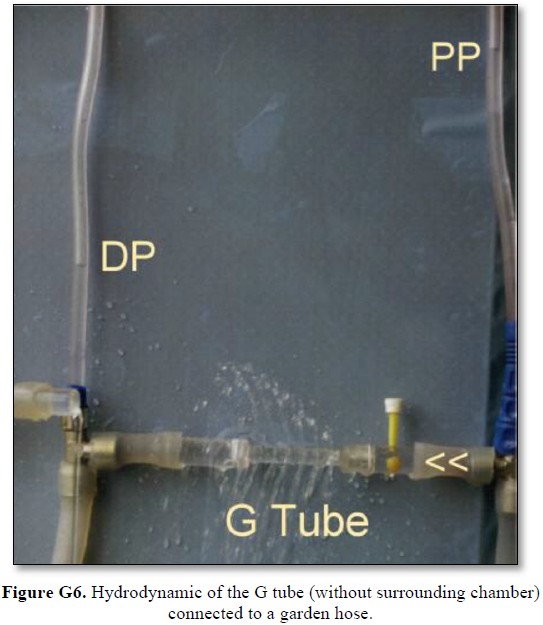
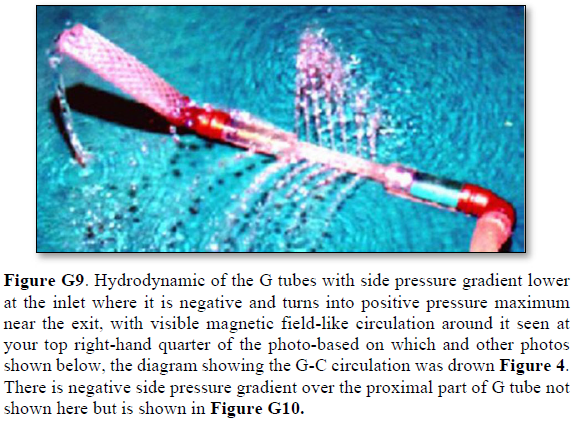
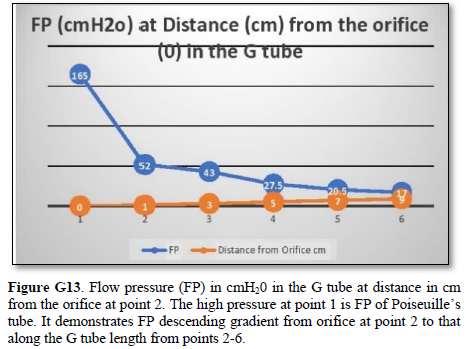
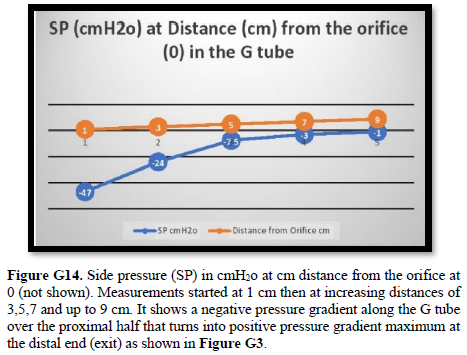
Bernoulli’s equation persistently gives a single low value of steady speed in the wide section of the capillary tube. The same formula yields low CBS or RBCs speed for the whole wide section of the tube but may only apply at the distal end of the capillary. The equation certainly does not apply at the precapillary sphincter, bulb, or the proximal capillary where we know the speed at the precapillary sphincter is high of 8.7 mm/s and at the capillary exit is 4.7 mm/s. So, there is a definite descending speed gradient along the capillary (Figures G5). The SP is also negative causing suction at the orifice or precapillary sphincter well known as Venturi’s effect. So, a modification of the equation to yield both speed gradient and negative SP gradient is in order, and the graph should show this negative side pressure gradient over the capillary length.
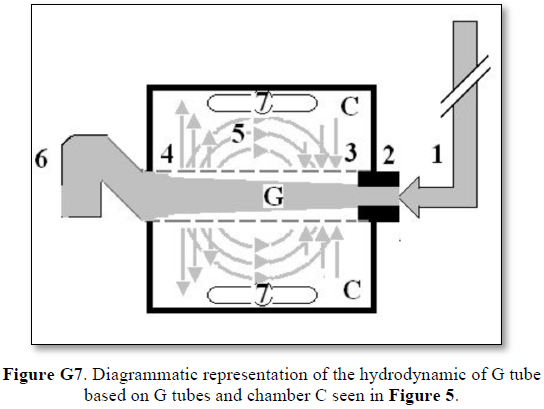
The fluid transfer of the G-C model (Figure G7) occurs according to a precise fast circulation of fluid between the G tube lumen and surrounding chamber C. This must also occur in the capillary, not the slow diffusion, that provide good adequate irrigation of the ISF space without oedema formation. This fast capillary-ISF circulation can account for the cell demand at rest and for higher demand of oxygen and nutrient delivery with removal of waste products during strenuous physical activity.
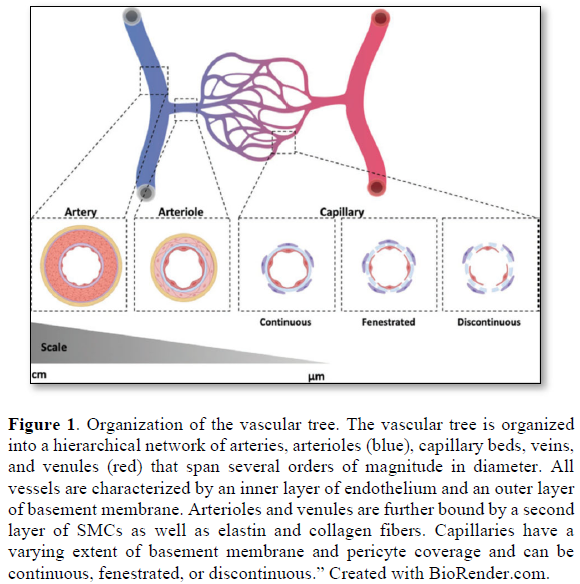

Figure G2. Microvasculature tree of head and neck showing arterial branching down to terminal arterioles but not the capillaries. It looks obvious that counting the number of terminal arteriole and the capillaries and calculating its total cross section area is a daunting impossible task. Yet it is possible and easier than one might think. It may be easier only when the TBL applies, please see text.

The authors stated in the figure’s legend: “At rest, the average RBC velocity through precapillary sphincters was 8.7 ± 0.6 mm/s Figure 4c, significantly higher than for the bulb (3.6 ± 0.6 mm/s) and the first order capillary (4.7 ± 0.6 mm/s), but correlated with the relative differences in the resting diameters of the vessel segments. As shown in Fig. 2g, high RBC velocity through the narrow lumen of the precapillary sphincter amplifies the reduction in pressure across the sphincter due to high shear, i.e., augments the reduction of pressure from larger proximal PAs to downstream capillaries. From the baseline measures, the pressure drop per unit length is 4-times larger in the sphincter than the first order capillary, assuming that RBC velocity and fluid velocity are equal see Figure G2. During whisker stimulation Figure 4c, both diameter and RBC velocity increased in each segment, but significantly more at the precapillary”.
So the dynamic variables in an apparently impossible future equation or equations should include:
However, as all the above dynamic variables are measurable the equation may be easier than one might think [14].
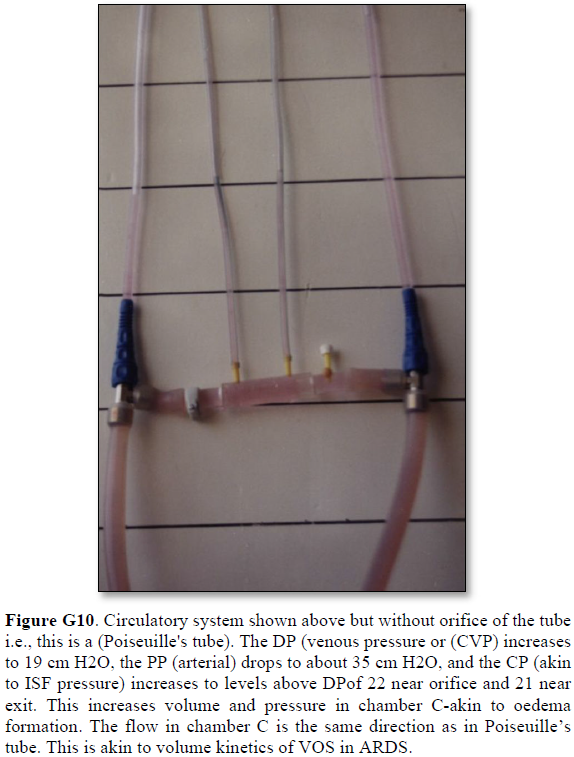
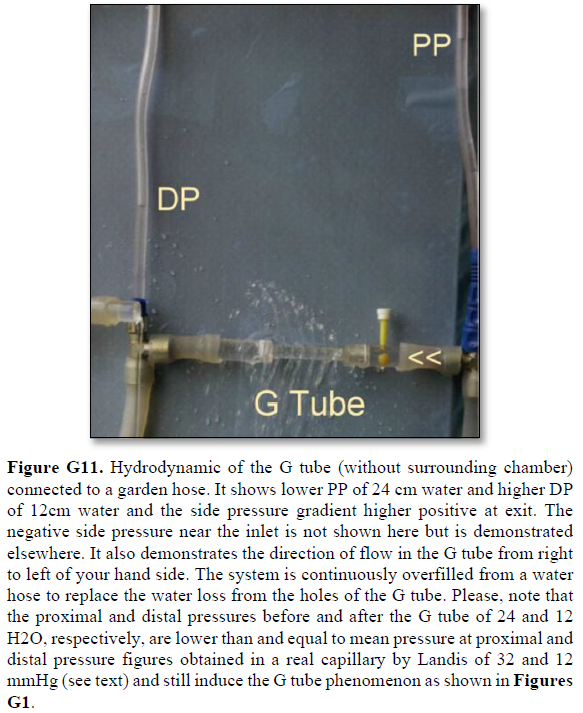
It shows lower PP of 24 cm water and DP of 12 cm water and the side pressure gradient higher positive maximum at exit. The negative SP near the inlet is not shown here but is demonstrated elsewhere Figures G7 and G10. The pressure gradient also demonstrates the direction of flow in the G tube from right to left hand side. The system is continuously overfilled from a water hose to replace the water loss from the holes of the G tube. Please, note that the proximal and distal pressures before and after the G tube shows values of 24 and 12 cm water, respectively, that are lower than and equal to measured pressure at proximal and distal ends of the capillary obtained in a real capillary by Landis of 32 and 12 mmHg (see text) and still induce the G tube phenomenon.

This 38-years old diagrammatic representation of the hydrodynamic of G tube in chamber Cis based on several photographs. The G tube is the plastic tube with narrow inlet and pores in its wall built on a scale to capillary ultra-structure of precapillary sphincter and wide inter cellular slit pores, and the chamber C around it is another bigger plastic tube to form the G-C apparatus. The chamber C represents the ISF space. The diagram represents a capillary-ISF unit that should replace Starling’s law in every future physiology, medical and surgical textbooks, and added to chapters on hydrodynamics in physics textbooks. The numbers should read as follows:
**Note the shape of the fluid jet inside the G tube (Cone shaped), having a diameter of the inlet on right hand side and the diameter of the exit at left hand side (G tube diameter). I lost the photo on which the fluid jet was drawn, using tea leaves of fine and coarse sizes that runs in the center of G tube leaving the outer zone near the wall of G tube clear. This may explain the finding in real capillary of the protein-free (and erythrocyte-free) sub-endothelial zone in the Glycocalyx paradigm. It was also noted that fine tea leaves exit the distal pores in small amount maintaining a higher concentration in the circulatory system- akin to plasma proteins.
What is wrong with capillary physiology?
Mentioned above in the received knowledge on capillary physiology there is one wrong physiological law and 2 misconception which are:
What is new about capillary physiology?
A. The hydrodynamics of the G tube:
The hydrodynamics of the G tube was reported as prelimenary report at Medical Hypothesis in 2001 [14] demonstrating its relevance to the haemodynamics of the capillay and as well as its clinical significance proposing the G tube phenomonon of magnetic fieeld-like fluid circulation between the capillary lumen and ISF space as the correct replacement for Starling’s law and hypothesis [14-19]. My contributions on the subject of G tube physics and capillary physiology [14-19], identifying two new vascular shocks [29,30] and resolving the puzzle of ARDS [31-33] are reported. Not only the exact patho-aetiology of ARDS was identified but also a possible preventable and curable therapy was suggested [31].
4. Hydrodynamics of the G tube: What are the new physics discoveries of physiological relevance?
The new hydrodynamics of the G tube with relevance to capillary physiology are summarised here.
The results of the G tube study clearly indicate and recognize the following new discoveries:
Thus, the hydrodynamics of the G tube demonstrate that the dynamic pressure of a moving fluid has 2 pressure components that are different from the hydrostatic pressure of a stagnant fluid:
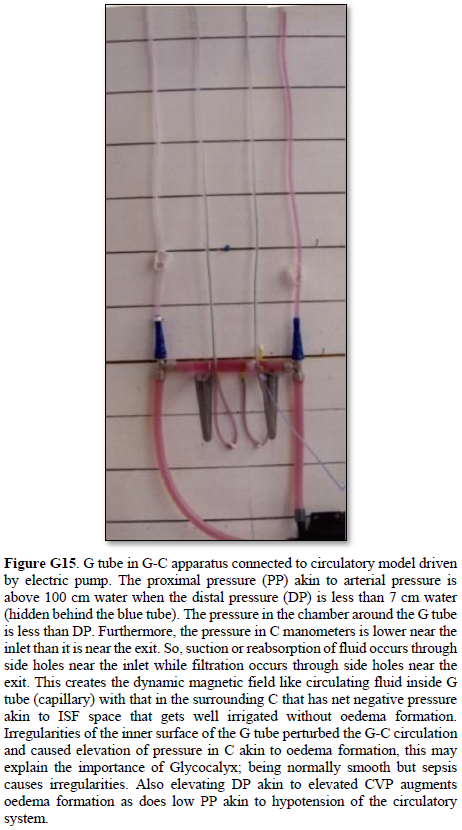
Both FP and SP of a dynamic flow are different from the hydrostatic pressure measured with a cannula occluding the lumen of the tube. This is named here as the MEASURED hydrostatic pressure (MHP) of the tube flow as measured by Landis in the capillary [6], which induce the SP gradient that induces the magnetic field-like phenomenon of the G tube in the capillary as shown in Figure G7. The G-C apparatus connected to a circulatory model and demonstrating the hydrodynamics of the G tube is shown in Figure G15.


5. The physics and physiological relevance of the hydrodynamic of the G tube to the haemodynamic of the capillary spicifically Starling’s law on the capillary-ISF transfer
This has been previously reported [14-17] and affirmed here. The clinical significance of applicability of the hydrodynamics of the G tube to the patho-etiology of the new volumetric overload shocks (VOS) [29] were also reported as volume kinetic shocks [30] causing ARDS [31-33].
The TBL is defined as and states that: “The trunk of a branching tree does not, and cannot, give rise to branches that have sum of all its cross-section areas larger than its own”. In other words: “The sum of all tree branches’ cross-section areas at any level is less than its own trunk”.
This TBL was originally based on observational theory on green trees and red vascular trees of the aorta and its arterial branches but has now been investigated and validated. The results of scientific, mathematical, and experimental evidence show that TBL is validly correct on all green and red trees as summarized here. This law rule applies further down the arterial tree to the terminal arterioles and capillaries, and up a green tree to its leaves as a branch becomes a mother trunk for its own sibling branches.
The TBL is not just a scientific curousity of trivial importance but very important for understanding capillary physiology. It verifies that the cross-section areas of the sum of all functional capillaries is less than that that of the aorta. This is the scientific basis that corrects the misconception that the cross section areas of the capillaries is “much greater” than the aorta- based on which the predicted RBCs speed is thought “very slow”, while in reality it is proved fast. The speed gradient of RBCs speed along the capillary must account for the magnetic field-like fluid circulation around the capillary as it occurs in the G tube (Figure G7) [17]. Furthermore, the TBL will allow accurate calculation of the capillaries in a human or animal based on data concerning the aorta’ maximum diameter and its cross section area and capillaries’ diameters. Currently this seems a daunting idea as based on this photograph of the microvascular tree of the head and neck (Figure G2). However, this shall prove feasible in the light of the new TBL reported here, when the precision engineering data on terminal arteriole’s measured diameter and its number of capillaries with its measured diameters become available in a true to life arteriole-capillaries-venule diagram or picture. The currently reported diagram on the arteriole-capillaries-venule unit (Figure G1) [20]lacks the above mentioned engineering precision data measurements, and wrongly swabs the colours of red and blue for the arteriole and venule.
The TBL was investigated and validated by the study investigations of all types of known trees which all proved TBL is valid and correct; it included the following trees.
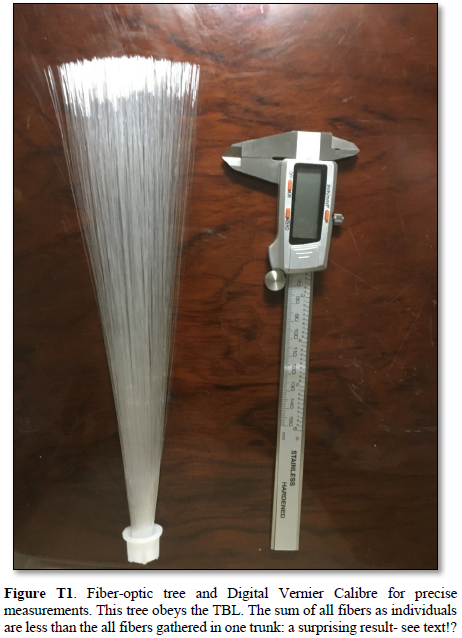
1. The Fiber-Optic Light Tree (Figure T1)
The cross section area of all fibres gathered in a trunk is 86.625 mm2. The cross section areas of all fibres individually calculated and summed up later is 62.857 mm2. So, the sum of cross section areas of all fibers individually is less than (72.562%) the trunk of all fibers gathered in one bundle- a rather surprising result as I initially though it might be equal.
2. The Green Trees
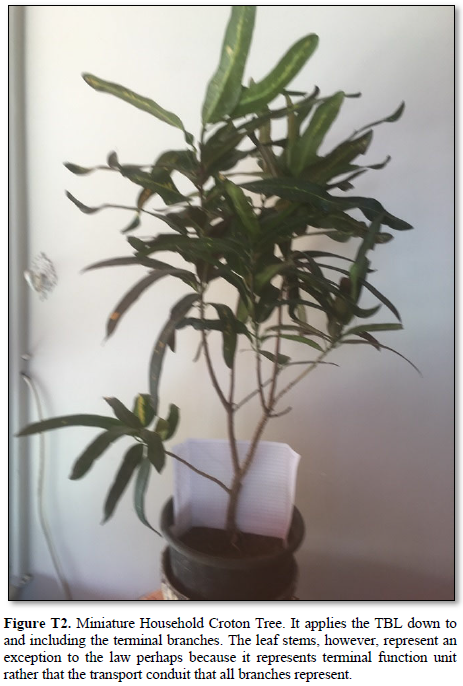
a. Household Miniature Croton Tree (Figure T2) The cross section area of the trunk is 27 mm2. The cross section areas of all the 1st order branches is 96.28 mm2. (90.599%) The cross section areas of all 2nd order terminal branches is 94mm2. (88.454% of the trunk) As branching continue, the cross section of all branches is less than its own mother branch, as well as being much less than the tree trunk. These findings were confirmed in all trees examined.

b. Nature Big Green Trees
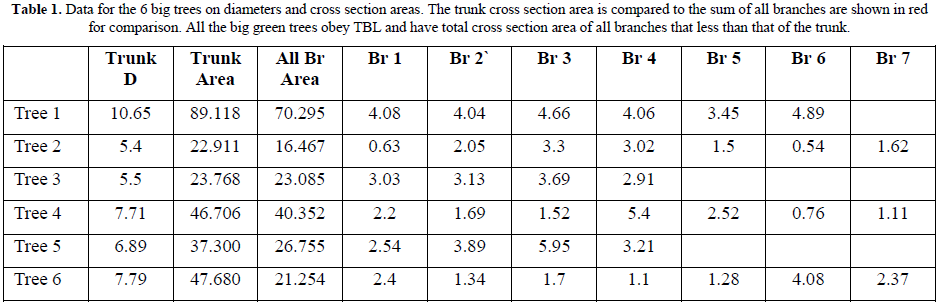
Samples representing all big trees of Gardens, Streets and Forest were studied. All types of trees obey TBL as in all trees the sum of cross section areas of all branches is less than that of the trunk (Table 1) and a descending trend extends to the terminal branches where leaves originate.
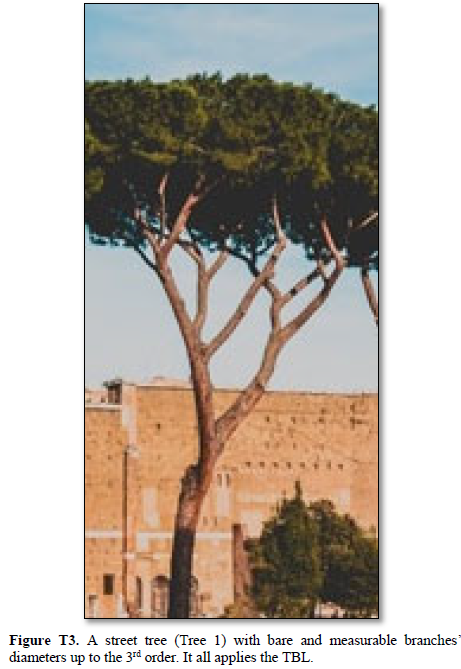
The street tree (Tree1) gives a good representation of the TBL as it has bare branches up to the 3rd level branches. The trunk of (Tree 1) based on (Figure T3) has a cross section area of 101.218 mm2 and gives rise to 2 branches of 1st order that have a sum of cross section areas of 83.958 mm2. (82.948%) The total cross section area of the 2nd order branches, that were 6 branches, 3 from each mother 1st order branch, have total sum of cross section areas of 64.661 mm2. (63.883% of the trunk) The same trend continues up the green tree to the level of terminal branches where the leaves originate.
3. The Red Aorta’s Tree:
Aorta’s Arterial tree in Humans (Figure T4)
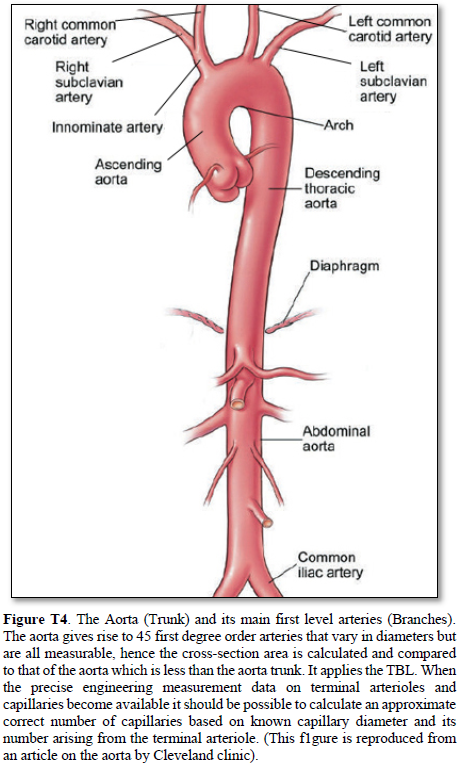
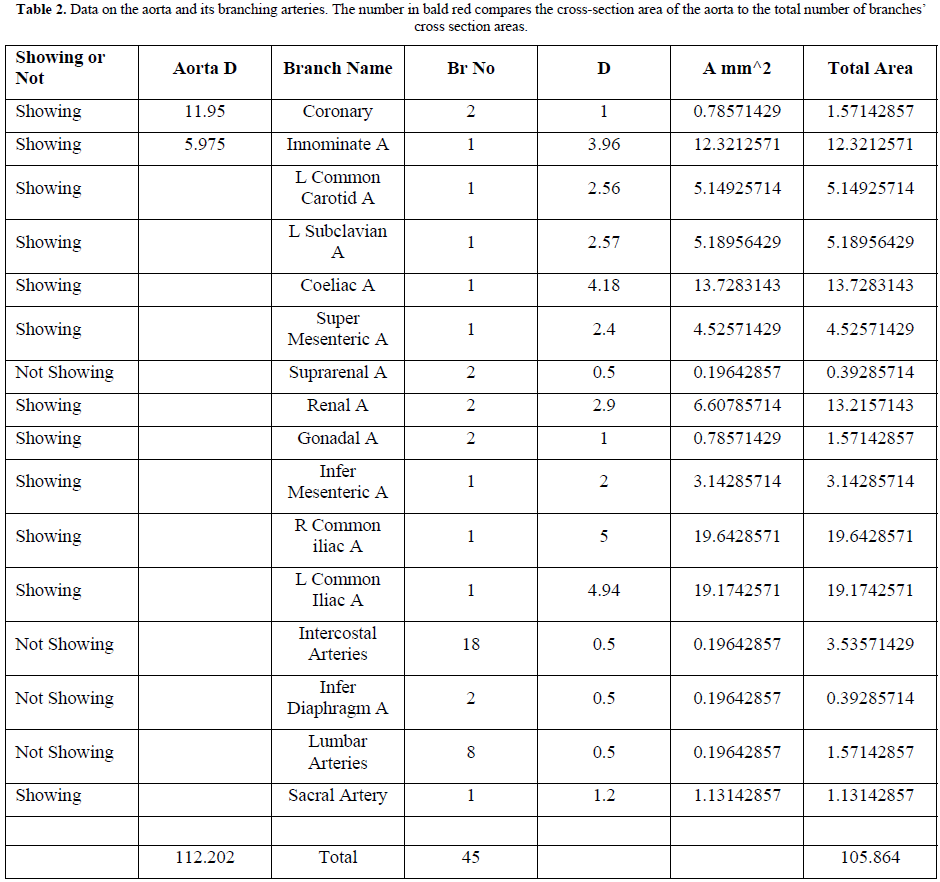
The aorta gives rise to 1st order branches of 45 arteries that have different diameters (Table 2). The ascending aorta’s maximum cross section area is 112.202 mm2 -based on measurements taken from (Figure T4). The measurements of diameters were taken on the outside diameter of aorta and arteries. The 1st order arteries (directly branching from the aorta) have a total sum of cross section areas of 105.86 mm2. (94.348%) So, the arteries have cross section areas that is less than the aorta. The same rule applies to all further down branching of arteries down to and including the terminal arterioles and precapillary sphincters.

The measurements of the aorta and its branching arteries were done on a photograph (Figure T4) measuring the diameters of aorta and arteries on the outside. This is to be replaced in a future study by the actual measurements of the inner diameters of the aorta and arteries taken from a hard cast after filling the aortic tree with liquid cement, leaving it to dry and harden up, then removing the walls of the aorta and arteries that can be done on a human cadaver and/or animal models. Such study should validate the TBL results reported here.
Arteriole-Capillaries-Venule Diagram (Figures G1)
The TBL applies to the aorta and its first order arterial branches and its syubsequent branches of all arteries down to and including the terminal arterioles and precapillary sphincters. The arteries are conduits involved in transporting the blood to capillaries that are the terminal functional units that serve the cells and tissues. Capillaries being the terminal functional units may or may not obey the TBL; the currently known data on arterioles and capillaries [4] are insufficient to finalize this issue for sure now.
A terminal unit of arteriole-capillaries-venule based on preferably an actual photograph if feasible or an engineering precision diagram on ultrastructural anatomy of the arteriole-capillaries unit which show the number of capillaries orginating from the terminal arteriole, giving the capillaries’ length and measured diameters, indicating whether it branches or not and the measured diameter of branches if any exist. The pressure and speed of blood flowing inside capillary lumen should be measured at both arterial and venous ends of the capillary. With these data available with known aorta’s diameter, it is possible to calculate the most likely numbers of capilleries or at least the functional capillaries in a human and/or animal. Also, the total cross-section areas of all the capillaries can be accurately calculated to define its relation with the aorta’s cross-section area. I think that at least the functional capillaries have a total cross section area that is smaller not larger than the aorta. The adequae available evidence for this notion is reported here.

The deductive evidence demonstrating that the totoal cross section area of the capillaries is less than that of the aorta, not more.
Deductive evidence demonstrate that the sum of all terminal arterioles’ cross section area is less than the aorta. This is based on the evidence from the TBL that the 1st order branching arteries have a total cross section area that is less than that of the aorta. Furthermore, the 2nd order arterial branches have a total cross section area that is less than the preceeding 1st order arteries and much less than the aorta. The trend continues down to the terminal arterioles. This trend is also seen in green trees. It was observed in every branching tree that the 1st order branches have a cross-section area that is less than that of the trunk. Further branching into 2nd order branches also show that the cross section area is smallar than the preceeding 1st order branches’ cross section area and much smaller than the trunk. From this rule it is deduced that the cross section area of all terminal arterioles is less than that of the aorta. The capillaries may follow suit despite its wider diameter that is the double of the precapillary sphincter, but not more than half the diameter of the feeding arteriole diameter. Hence, the cross section area of all capillaries is much less than the aorta.
The mathematical evidence demonstrating that the totoal cross section area of the capillaries is less than that of the aorta, not more.
The precision engeneering diagram of terminal arteriole and capillaries (Figure G1) demonstrates that 3 capillaries branch from the terminal arteriole each have a diameter less than half of the arteriole. The diameters of the arteriole is 2.61 mm and of the 3 capillaries it originate from it are 0.48,1.5 and 1.3 mm which have a cross section area for the arteriole of 5.352 mm2 and for the 3 capillaries the sum total of cross section area is 3.276 mm2. (61.211%) This means that the total sum of cross section areas of the capillaries is less than that of the arterioles and therefore much less that that of the aorta, not more.
In the none existing event of case senario that an arteriole gives rise to 4 capillaries each has a diameter that is half that of its own then the cross section area of capillaries equals that of the arterioles, not more, and the total cross section areas of all capillaries remain much less than that of the aorta. Almost certainly the cross section area of all the functional capillaries are less than that of the aorta, never more. I am happy with the above provided evidence but do not mind considering it a theory for now to be validated when future precision data on the arteriole-capillaries-venule unit’s exact ultrastructure anatomy with measurements becomes available.
The clinical significance of replacing Starling’s law with the G tube magnetic field-like fluid phenomenon and correcting other misconceptions.
Physiologists and physicists may be reluctant to support the truth brought about by the discovery of the hydrodynamics of the G tube denying its applicability to the capillary hemodynamic, being most concerned about formulae and calculations. Physicians, however, particularly Anesthetists, Surgeon, and Intensivists are most concerned about the lives and safety of their shocked, acutely ill patients and patients undergoing major surgery.
Physicians who must rely on Starling’s law for giving intravenous fluid therapy in clinical practice do realize the seriousness of this affair. These Physicians know that Starling’s law does not hold in these clinical settings: Being wrong has induced errors and misconceptions on fluid therapy [28]. These errors mislead physicians into giving too much fluid during the resuscitation of shock, acutely ill patients, and prolonged major surgery [29]. It thus induces the volumetric overload shocks (VOS) [31] also reported as volume kinetic (VK) shocks [32] that cause the acute respiratory distress syndrome (ARDS) [33-35] or the multiple organ dysfunction syndromes (MODS).
Not only the exact patho-aetiology of ARDS was identified but also a possible prevention and curable therapy is advanced and recommended [31,32]. So, ARDS is not caused by sepsis and Covid-19 only but also by VOS though remaining unrecognized and underestimated. Sepsis is managable by the use of appropriate and adequate powerful abntibiotics that exist today. Covid-19 that kills its victims by inducing ARDS is transient and willsoon go away or a vaccination will materialize that puts it dormant in history like other eradicated infectios diseases by the effective vaccination. Meanwhile, ARDS induced by VOS shall remain unrecognized and underestmated killing hundreds of thousands of patients all over the World each year unless Starling’s law is disposed off and better policy on fluid therapy is implemented and every practicing physician in the World particularly those involved in fluid therapy knows about it.
The faulty Starling’s law is the primary culprit responsible for the death of hundreds of thousands of ARDS patients every year all over the World [31-33]. This is preventable and curable when the truth on the G tube discovery can prevail and shine. All should welcome the new discoveries in physics, physiology, and medicine [34]. The physics, physiological and clinical evidence is so overwhelming that it justifies saying farewell: “Goodbye Starling’s law, hello G tube” [35].
CONCLUSION
This article presents concisely what is known about the capillary ultrastructure anatomy and physiology as is currently tought in medical schools and reported in all physiology textbooks. Yet the this knowledge on capillary physiology has missing data, errenous law and two misconceptions, identified in the what is unkown or missing section and on what is wrong with current understanding of capillary physiology. The section of what is new presents a summary of the G tube discovery of hydrodynamics, how it proves Starling’s law is wrong and provides the corrcet replacement of the magnetitic field-like fluid circulation phenonenon for explaining the capillary-ISF transfer. Also the the Tree Branching Law (TBL)corrects the misconceptions that the total cross section areas of all the capillaries is very much greater than the Aorta, and the capillary blood speed is very slow to allow for the slow perfusion equilebrium state between the capillary blood and ISF space as based on the currently received but incorrect Starling’s forces.
The currently missing data on capillary physiology include: A representative model of the arteriole-capillaries-venule unit with precise measurements of the arteriole and capillaries diameters and capillary number branches for the accurate calculations for the cross section areas of the capillaries in relation to that of the Aorta. Also the speed of RBCs or CBS shoulkd be measured at both the arterial and venous ends of the capillary.
The section of what is new on the capillary physiology summarises the new discovery of the G tube hydrodynamics provideng the correct replacement for the wrong Starling’s law, namely the magnetic field-like fluid circulation that explains well the capillary-ISF transfer that effecientlty provide for the cell and tissue viability at rest and during streneous exercise. The TBL provides substantial evidence that rectifies the misconceptions on capillary cross section areas to show that it is less than that of the Aorta, and speed of blood is really fast to allow for the magnetic field-like fluid circulation between capillary blood and the surrounding ISF space to operate.
The missing data on capillary physiology should direct future research. Correcting the wrong Starling’s law and the misconceptions should pave the way for the new magnetic field-like fluid dynamics of of the G tube to improve understanding of and be implemented inthe capillary-ISF transfer. These will undoubtedly help in resolving the clinical problems of recognizing the new volume kinetic shocks or volumetric overload shocks causing the acute resiratory distress syndrome that complicate fluid therapy in hospital practice due the wrong rules being diucated by the wrong Starling’s law.


REFERENCES
No Files Found


Internationally Accepted
Share Your Publication :