
-
Publish Your Research/Review Articles in our High Quality Journal for just USD $99*+Taxes( *T&C Apply)
Offer Ends On
Publish Your Research/Review Articles in our High Quality Journal for just USD $99*+Taxes( *T&C Apply)
Offer Ends On
Pinak Patel*, Yesha Patel, Shivani Jani and Krunal Detholia
Corresponding Author: Pinak Patel, Department of Pharmaceutical Quality Assurance, Smt. S.M. Shah Pharmacy College, Amsaran, Gujarat, India.
Received: April 29, 2022 ; Revised: May 3, 2022 ; Accepted: May 6, 2022 ; Available Online: May 20, 2022
Citation: Patel P, Patel Y, Jani S & Detholia K. (2022) Quantitative Computation of Synthetic Mixture Comprising Sitagliptin and Dapagliflozin from Synthetic Mixture by Vierdot’s Method. J Pharm Sci Drug Discov, 1(2):1-5.
Copyrights: ©2022 Patel P, Patel Y, Jani S & Detholia K. This is an open-access article distributed under the terms of the Creative Commons Attribution License, which permits unrestricted use, distribution, and reproduction in any medium, provided the original author and source are credited.
Views & Citations
Likes & Shares
Abstract
Current research paper describes highly specific, reproducible and efficient Vierdot’s method also known as simultaneous equation method for quantitative computation of synthetic mixture comprising Sitagliptin which is a DPP4 inhibitor and Dapagliflozin which is SGLT2 inhibitor. Both active components belong to the therapeutic class of anti-diabetics. Present UV spectrophotometric method was developed on Shimadzu double beam spectrophotometer equipped with UV probe 2.42 as software using methyl alcohol as solvent. As per the requirements of Vierdot’s method, 224 nm and 267 nm was selected as analytical wavelength for quantification of Sitagliptin and Dapagliflozin which is their respective λmax. Method showed linear response in the range of 50-150 µg/mL of Sitagliptin and 5-15 µg/mL of Dapagliflozin. The main requirement of having glen ration outside the range of 0.1-2.0 was also satisfied at each concentration level. Method was found to be accurate with recovery between 96.8 - 98.2 % for Sitagliptin and 99.6 - 100.8 % for Dapagliflozin. The developed method was validated as per ICHQ2R1 guidelines and was successfully applied for quantitative analysis of synthetic mixture of Sitagliptin and Dapagliflozin.
Keywords: Sitagliptin, Dapagliflozin, Simultaneous equation method, Glen ratio, Analytical method validation
INTRODUCTION
Sitagliptin (SITA) acting as Anti-Diabetic agent (Dipeptidyl peptidase-4 inhibitor) which boosts post prandial insulin release decreases Glucagon secretion and lower mean time as well as fasting blood glucose in type 2 diabetes mellitus. [1]. This agent is used in combination with other oral hypoglycemic agents. Dapagliflozin (DAPA) acts as Sodium-Glucose cotransporter-2(SGLT2) inhibitor. This agent is used in combination with diet and exercise to improve glycemic control in adult with type -2 diabetes mellitus. SGLT 2 is major transporter of glucose whose inhibition induces glycosuria and lower blood sugar in type 2 diabetes mellitus. [2] According to the clinical trial Study of real-World Evidence with SGLT2i (DAPA) and DPP4i (SITA) in Type-2 diabetes mellitus patients in Spain (NCT04149067) which shows beneficial positive effect on patient of Diabetes Mellitus (Type-2) at the close level of 5-10 mg of DAPA and 50-100 mg of SITA. [3] Best clinical effectiveness was observed at 100 mg dose of SITA and 10 mg of DAPA and hence for method development purpose dose was selected as a mixture comprising 10 mg of DAPA and 100 mg of SITA. Several analytical methods are available which can determine SITA and DAPA individually or in combination with another drug [4-23]. From detailed review of literature, it was found that no analytical method is available for determination of DAPA and SITA from simulated mixture or formulation. Furthermore, UV spectrophotometric methods are more convenient with respect to operation in comparison with chromatographic methods of analysis. In additional, Simultaneous equation method aids virtue of selectivity to the analytical method due to estimation of components at λmax of individuals and the glen ratio was determined. So, for the same reason simultaneous equation method was selected as method of choice from all other multi component UV spectrometric methods.
MATERIALS AND METHOD
Instrument Chemicals and Reagents
DAPA (99.98% pure) and SITA (99.96% pure) were obtained as gift sample for research purpose from, Cadila Healthcare Ltd., Sanand. Methyl alcohol (LR grade) was purchase from S.D. fines. All other excipients required for study were available at research institutions. Spectrophotometric analysis was performed on Shimadzu UV-1800 double beam Spectro photo-meter having path length of 1 cm matched with pair of 10 mm quartz cells. Obtained spectra of SITA and DAPA were overlapped using UV probe 2.42 as software.
Preparation of stock solution and Master stock solution
For the method development purpose, 50 mg of SITA was weighed and diluted to 50 mL (1000 µg/mL) and was further diluted to give final concentration of 250 µg/mL. In similar way 50 mg of DAPA was weighed and diluted to 100 ml (500 µg/mL) and was further diluted to give final concentration of 25 µg/mL.
Selection of analytical wavelength and optimization of model
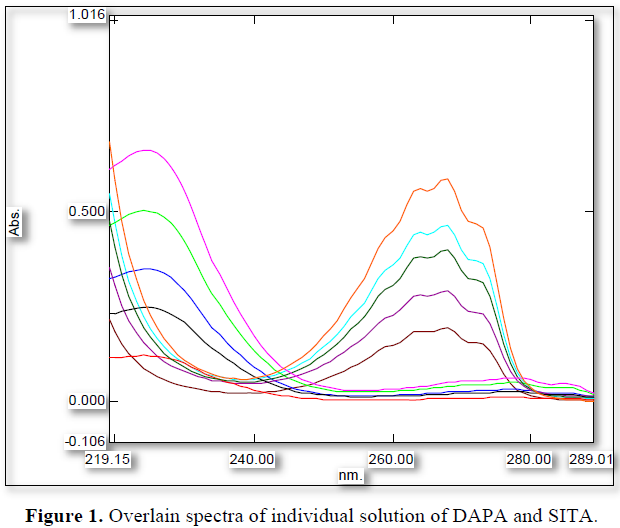
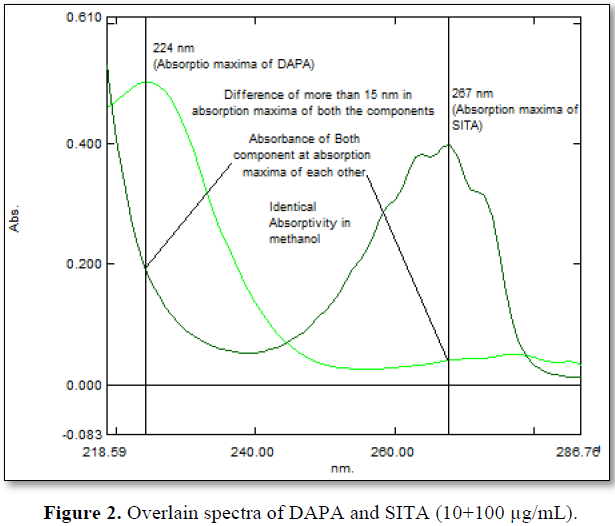
For selection of Analytical wavelength, working standards of SITA (100 µg/mL) and DAPA (10 µg/mL) was scanned and overlapped with the help UV probe 2.42 software and all criteria for developing simultaneous equation method was assessed at obtained λmax of each drug component. For optimization of simultaneous equation model, absorbance of mixture (10+100 µg/mL) was taken and glen ratio was assessed at proposed concentration level.
Preparation of solution for linearity and range
For method development purpose solution of SITA were prepared in the concentration level of 50 - 150 µg/mL and for DAPA the solution was prepared in the range of 5-15 µg/mL. To adjudge overall linearity, mixture of DAPA and SITA in the ratio of 1:10 (i.e 5+50, 7.5+75, 10+100, 12.5+125 and 15+150 µg/mL) were prepared. To observe the linearity, calibration curve was plotted and regression coefficient was observed.
Intermediate precision (Repeatability)
To adjudge the repeatability of analytical method, solution of linearity studies was analyzed for five time with same conditions. Absorbance was recorded at wavelength of DAPA (224 nm) and SITA (267 nm) for all concentration and relative standard deviation was observed.
Method Precision
Method precision was determined by performing intraday and interday precision. Mixture that represents overall range (5+50, 10+100 and 15+150 µg/mL) were analyzed on same day at different time interval for intraday precision. Mixture that represents overall range (5+50, 10+100 and 15+150 µg/mL) were analyzed on different days for interday precision. To adjudge the method precision, value of RSD was monitored.
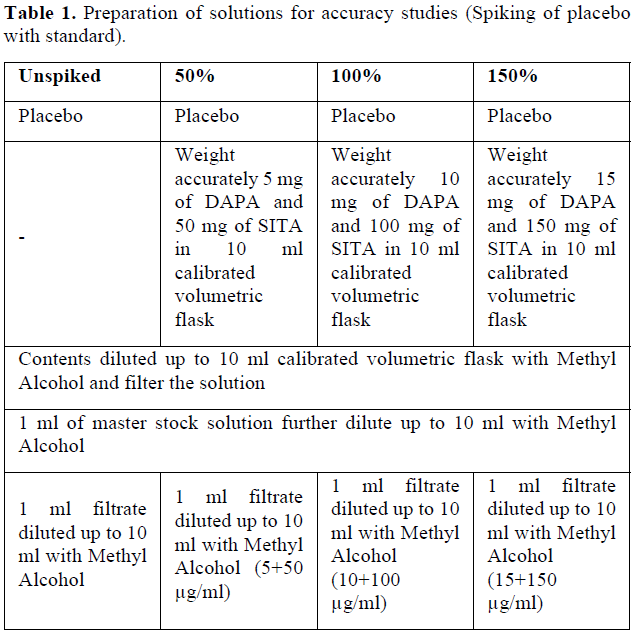
Accuracy study
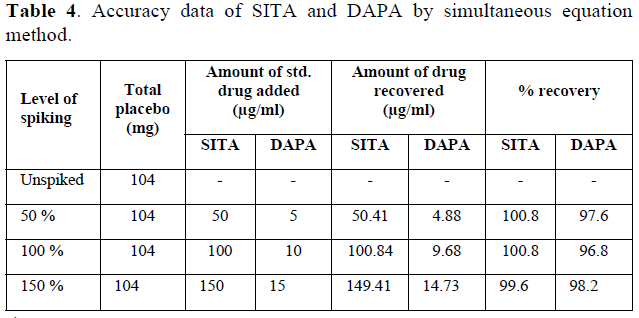
Accuracy of analytical method was adjudged by spiking of placebo with standard solution. Mixture containing 100 mg of directly compressible lactose, 2mg of talc and 2 mg of magnesium stearate was selected as placebo and was spiked at 50, 100 and 150% of target concentration (5+50 µg/mL) (Table 1). Placebo (un spiked) was analyzed at given wavelengths for any possible interference. Each spiked concentration was analyzed for three times and mean % recovery was observed at each spiked level.
Assay
As the proposed synthetic mixture is having dose of 10 mg of DAPA and 100 mg of SITA, was mixed with selected placebo, and diluted appropriately to give mixture containing 50 µg/ml of SITA and 5 µg/ml of DAPA. This mixture was scanned between 200-400 nm at the wavelength of DAPA and SITA. Absorbance was measured at selected wavelength of DAPA (224 nm) and SITA (267 nm) were transformed to concentration with help of linear regression equation. This mixture was analyzed for three times and mean % assay was drawn.
RESULTS AND DISCUSSION
Selection of analytical wavelength and optimization of model
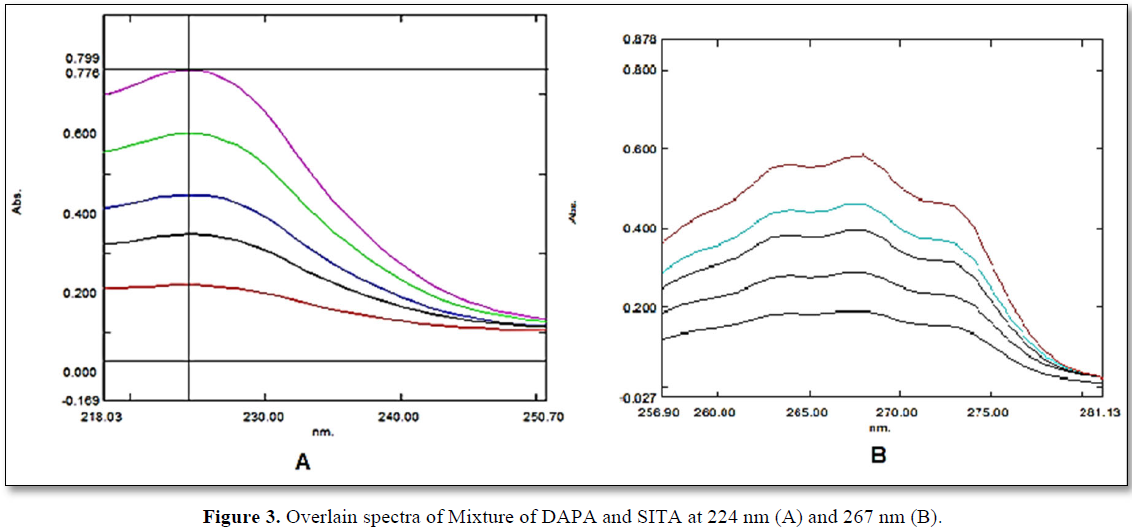
When the working standards of SITA (x) (50 – 150 µg/mL) and DAPA (y) (5 – 15 µg/mL) were prepared using methyl alcohol as a solvent, 224 (λ1) nm and 267(λ2) nm was selected as analytical wavelength as both the components were imposing significant absorbance at that wavelength. 224 and 267 nm was also the λmax DAPA and SITA respectively (Figure 1). Even all criteria for developing simultaneous equation method were satisfied at the mentioned wavelengths (Figure 2). Furthermore, the glen ratio was assessed by taking absorbance of mixture at 224 nm (A1) and at 267 nm (A2) at concentration level of 10+ 100 µg/mL of DAPA and SITA, which was found to be lying outside the range of 0.1 to 2. In addition, all prepared mixtures in ratio of 1:10 were analyzed for glen ratio and each glen ratio at each concentration level was found to be outside the range of 0.1 to 2.0.
Analytical Method Validation
All validation parameters were studied as per ICH guidelines.
Linearity and Range
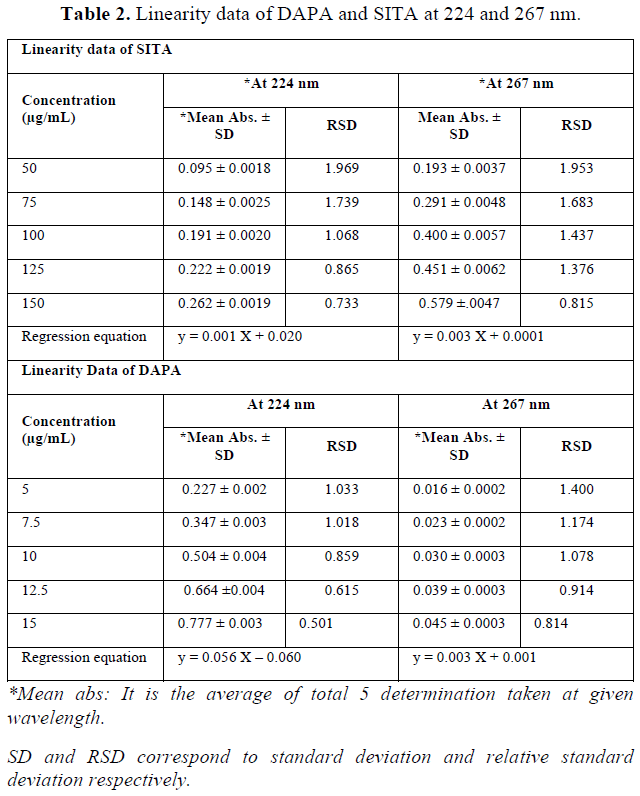
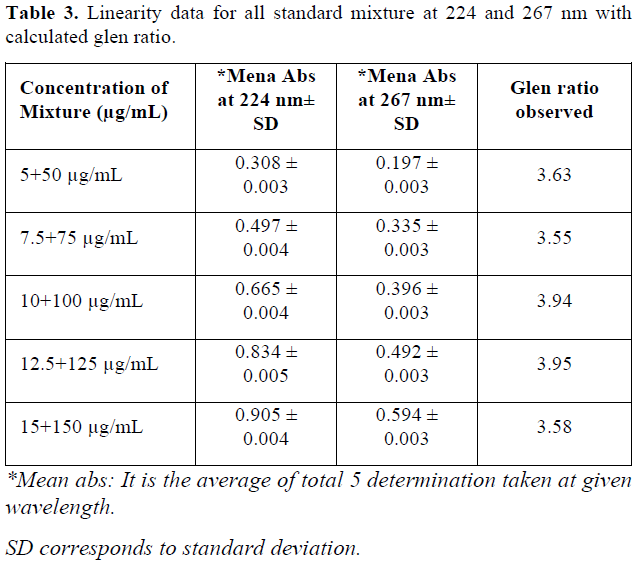
It was found that during observing all concentration of SITA, non-linearity was observed below 25 µg/mL and above 150 µg/mL of SITA and hence range was kept between 50-150 µg/mL. For DAPA the non-linearity was observed above 20 µg/mL and hence by taking ratio of synthetic mixture into consideration (1:10), range of DAPA was kept between 5-15 µg/mL. Beer-Lambert law is also being satisfied at the selected concentration level. When calibration curve was plotted for given concentration range at selected wavelengths, value of linear regression coefficient was found to be 0.991 and 0.991 for SITA at 224 nm and 267 nm respectively. For DAPA, the value of regression coefficient was found to be 0.996 and 0.995 at 224 nm and 267 nm respectively. Regression equation was found to be y = 0.001 X + 0.020 for SITA at 224 nm and y = 0.003 X + 0.0001 at 267 nm. In the same way regression equation for DAPA was found to be y = 0.056 X – 0.060 at 224 nm and y = 0.003 X + 0.001 at 267 nm (Table 2) value of absorptivity (ax1, ax2, ay1 and ay2) were determined from linear regression equation. All prepared mixtures were also found to be linear with respect to absorbance at 224 nm 267 nm (Figure 3). When value of glen ratio was assessed at each concentration level of mixture, the ratio was found to be beyond range of 0.1-2.0, by the same we can conclude that estimation of SITA and DAPA can be done accurately without any interference (Table 3).

Repeatability
When all mixtures were analyzed at all concentration, calculated relative standard deviation at each level was found to be less than 2 so that method was found to be repeatable over the range of 50 - 150 µg/ml for SITA and 5 - 15 µg/ml for DAPA. Total five determinations were made at each concentration level.
Method precision
For determining inter day and intraday precision, %RSD was monitored at selected concentration level which was found to be less than 2 so method was found to be precise for estimation of SITA and DAPA.
Accuracy study
The developed method was found to be accurate as value of % recovery at each spiked level was found to be in the range of 98-102. It suggests that the excipients used as placebo were not interfering in the estimation of DAPA and SITA (Table 4), and hence, the developed method was found to be accurate for estimation of DAPA and SITA from synthetic mixture.
Assay
When prepared synthetic mixture was analyzed by developed and validated method, % assay was found to be 100.0 + 0.6 for SITA and for 100.1 + 0.7 DAPA.
SUMMARY AND CONCLUSION
The Simultaneous equation method was developed and validated as per ICHQ2R1 guidelines and was successfully applied for determination of SITA and DAPA from its synthetic mixture. Present method was found to be economical in terms of cost and time. Commonly used excipient didn’t interfere in estimation of SITA and DAPA and hence, the developed method was found to be specific, repeatable and precise.
ACKNOWLEDGEMENTS
Authors are extremely grateful to Cadila Healthcare Ltd. For providing gift sample of DAPA and SITA without them this work would not have taken place. We are also thankful to overall research teams who have contributed in either of the way. The authors are also grateful to Smt. S.M. Shah Pharmacy College for providing excellent research facilities and promoting research activities.


REFERENCES
No Files Found


Internationally Accepted
Share Your Publication :